Nursery and greenhouse labourers

Nursery and greenhouse labourers

NOC
85103

cultivate and harvest trees, shrubs, flowers and plants, and serve nursery and greenhouse customers.

Quick facts

3-Year Outlook

Moderate
Moderate

3-Year Job Openings

-36
 

Median Hourly Wage

$17.00
$15.30
Low
$28.08
High

Average Salary

$35,500
 

Typically Required

High school / on-the-job training

Employed

584
 
Job details

Full NOC Description

Nursery and greenhouse labourers plant, cultivate and harvest trees, shrubs, flowers and plants, and serve nursery and greenhouse customers. They are employed in indoor and outdoor nurseries and greenhouses.

Main Duties

This group performs some or all of the following duties:
  • Prepare soil; plant bulbs, seeds and cuttings; graft and bud plants; and transplant seedlings and rooted cuttings
  • Monitor plants for healthy growth and potential weed, insect, disease, and fertilizer problems in greenhouse crops
  • Spray trees, shrubs, flowers and plants to prevent disease and pests
  • Position and regulate greenhouse and outdoor irrigation systems to water plants and fields
  • Dig, cut and transplant trees, shrubs, flowers and plants and prepare them for sale
  • Provide information to customers on gardening, the use of various garden tools and products and the care of trees, shrubs, flowers, plants and lawns
  • May operate tractors and other machinery and equipment to fertilize, cultivate, harvest and spray fields and plants
  • Maintain inventory and order materials as required
  • Clean working areas.
  • Also Known As

    • forest nursery labourer
    • greenhouse labourer
    • horticulture labourer
    • hothouse labourer
    • hydroponics worker
    • nursery labourer
    Requirements

    Employment Requirements

    Completion of secondary school may be required.
  • Completion of college courses in horticulture or a related field may be required.
  • On-the-job training is provided.
  • A provincial licence to apply chemical fertilizers, fungicides, herbicides and pesticides may be required.
  • Provincial Regulation

    Not Provincially Regulated

    Employment by Sex

    The following graph shows the percentage of men and women working in this occupation in New Brunswick.

    Data legend

    51.3%
    Female
    48.7%
    Male
    Employment by age

    The following graph shows the breakdown of all persons working in this occupation in New Brunswick by age group.

    Data legend

    31.0%
    15-24
    10.6%
    25-34
    15.0%
    35-44
    14.2%
    45-54
    21.2%
    55-64
    8.0%
    65+
    Employment by highest level of education

    The following graph shows the breakdown of all persons working in this occupation in New Brunswick by highest level of education achieved.

    Data legend

    20.3%
    No Certificate, Diploma or Degree
    50.2%
    High School, Diploma or Equivalent
    3.5%
    Apprenticeship or Trades Certificate or Diploma
    18.1%
    College or University Below Bachelor Level
    7.9%
    University - Bachelor Level or Above
    Employment by Industry

    The following graph shows the industry groups in which the largest shares of persons working in this occupation in New Brunswick are employed. Small percentages for all top three industry groups may suggest employment for this occupation is widely distributed amongst many industry groups.

    Data legend

    86.8%
    Agriculture, forestry, fishing and hunting
    6.1%
    Manufacturing
    N/A
    N/A
    7.0%
    All Other Industries
    Employment by Economic Regions

    The following graph shows the breakdown of all persons employed in this occupation in New Brunswick by which economic region they reside in.

    Data legend
    16.50%
    Northeast
    28.70%
    Southeast
    10.40%
    Southwest
    20.90%
    Central
    23.50%
    Northwest
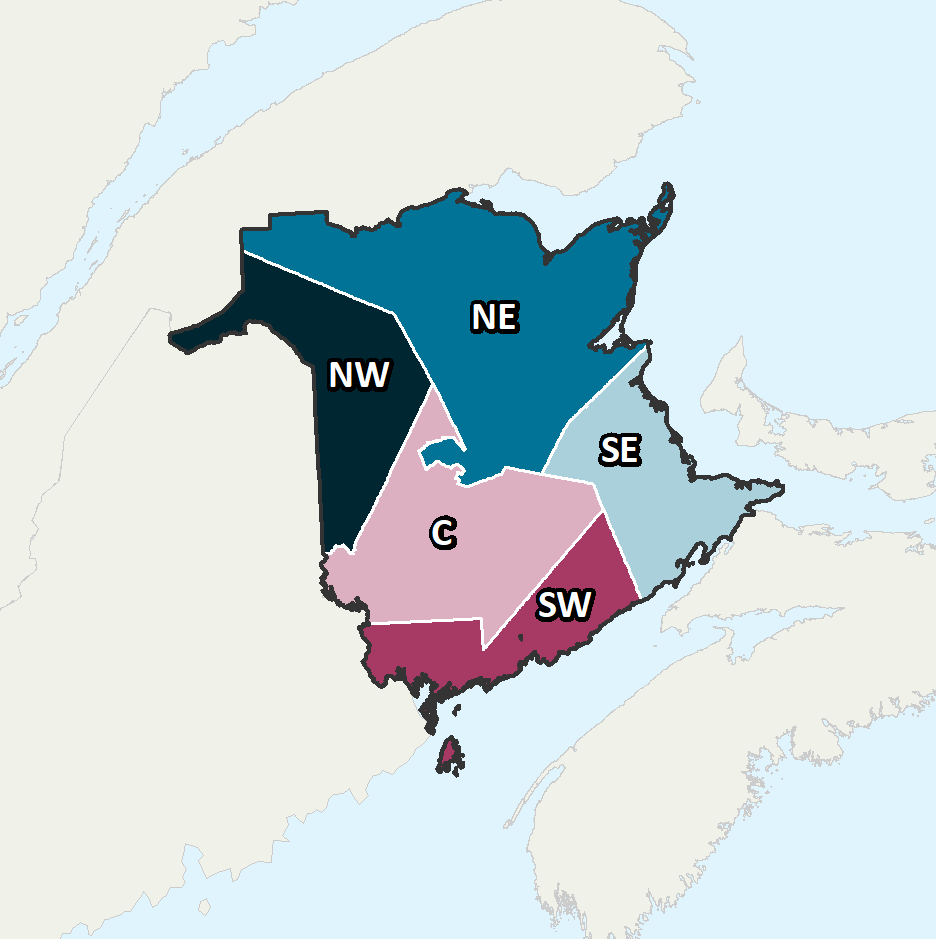
    Province of New Brunswick Economic Regions

    Economic Regions

    The following map displays New Brunswick’s five economic regions. An economic region (ER) is a grouping of counties, created as a standard unit for analysis of regional economic activity across Canada.

    Annual Average Salary by Economic Regions

    The following graph shows the average salary of all persons employed in this occupation in each of New Brunswick’s five economic regions.

    Data legend

    $32,000
    Northeast
    $40,000
    Southeast
    N/A
    Southwest
    N/A
    Central
    $32,000
    Northwest
    Province of New Brunswick Economic Regions

    Economic Regions

    The following map displays New Brunswick’s five economic regions. An economic region (ER) is a grouping of counties, created as a standard unit for analysis of regional economic activity across Canada.

    Hourly Median Wages by Economic Regions

    The following represents the median hourly wage of all persons employed in this occupation in each of New Brunswick’s five economic regions.

    No Data Available
    No Data Available

    Southwest

    $16.90
    $15.30
    Low
    $33.75
    High

    Central

    $15.30
    $15.30
    Low
    $16.00
    High

    Northwest

    $15.00
    $15.30
    Low
    $19.00
    High
    Salary

    The following shows the average salary of everyone who worked full-time and year-round in this occupation across each of the Atlantic Provinces and nationally.

    New Brunswick

    $35,500

    Newfoundland

    $36,000

    Prince Edward Island

    $40,000

    Nova Scotia

    $35,000

    Canada

    $37,840
    Employment Outlook

    The following represents the number of job openings that are expected to occur in this occupation over the next three and ten years respectively, broken down by openings expected to result from growth (“new jobs”) and openings expected to result from attrition (death and retirements).

    Three Year Outlook

    Total Openings: 3-Year

    -36
     

    New Jobs: 3-Year

    -76
     

    Retirements/Deaths: 3-Year

    42
     

    Ten Year Outlook

    Total Openings: 10-Year

    39
     

    New Jobs: 10-Year

    -90
     

    Retirements/Deaths: 10-Year

    131