Power system electricians

Power system electricians

NOC
72202

install, maintain and repair electrical power generation, transmission and distribution system equipment.

Quick facts

3-Year Outlook

Good
Good

3-Year Job Openings

7
 

Median Hourly Wage

$37.19
$0.00
Low
$0.00
High

Average Salary

$84,000
 

Typically Required

College or apprenticeship

Employed

97
 
Job details

Full NOC Description

Power system electricians install, maintain, test and repair electrical power generation, transmission and distribution system equipment and apparatus. They are employed by electric power generation, transmission and distribution companies. Apprentices are also included in this unit group.

Main Duties

This group performs some or all of the following duties:
  • Install and maintain electrical power distribution equipment such as transformers, generators, voltage regulators, switches, circuit breakers, capacitors, inductors, and supervisory control and data acquisition (SCADA) systems
  • Install and maintain electrical equipment and apparatus in generating stations or powerhouses
  • Inspect and test installed electrical equipment and apparatus to locate electrical faults and check their operation, using volt meters, ammeters and other electrical test instruments and equipment
  • Repair or replace faulty electrical equipment and apparatus
  • Complete test and maintenance reports.
  • Also Known As

    • apprentice power system electrician
    • power electrician
    • power station electrician
    • power system electrician
    Requirements

    Employment Requirements

    Completion of secondary school is usually required.
  • Completion of a four-year apprenticeship program for power system electricians or A combination of over four years of work experience in the trade and some college or industry courses in electrical technology is usually required.
  • Trade certification is available, but voluntary, in Manitoba, Alberta, the Yukon, the Northwest Territories and Nunavut.
  • Provincial Regulation

    • Provincially Regulated: Yes
    • Compulsory: No
    • Red Seal: No

    Regulation Body

    Employment by Sex

    The following graph shows the percentage of men and women working in this occupation in New Brunswick.

    Data legend

    0.0%
    Female
    100.0%
    Male
    Employment by age

    The following graph shows the breakdown of all persons working in this occupation in New Brunswick by age group.

    Data legend

    0.0%
    15-24
    15.8%
    25-34
    42.1%
    35-44
    21.1%
    45-54
    21.1%
    55-64
    0.0%
    65+
    Employment by highest level of education

    The following graph shows the breakdown of all persons working in this occupation in New Brunswick by highest level of education achieved.

    Data legend

    0.0%
    No Certificate, Diploma or Degree
    0.0%
    High School, Diploma or Equivalent
    55.0%
    Apprenticeship or Trades Certificate or Diploma
    45.0%
    College or University Below Bachelor Level
    0.0%
    University - Bachelor Level or Above
    Employment by Industry

    The following graph shows the industry groups in which the largest shares of persons working in this occupation in New Brunswick are employed. Small percentages for all top three industry groups may suggest employment for this occupation is widely distributed amongst many industry groups.

    Data legend

    90.0%
    Utilities
    N/A
    N/A
    N/A
    N/A
    10.0%
    All Other Industries
    Employment by Economic Regions

    The following graph shows the breakdown of all persons employed in this occupation in New Brunswick by which economic region they reside in.

    Data legend
    N/A
    Northeast
    N/A
    Southeast
    35.00%
    Southwest
    40.00%
    Central
    N/A
    Northwest
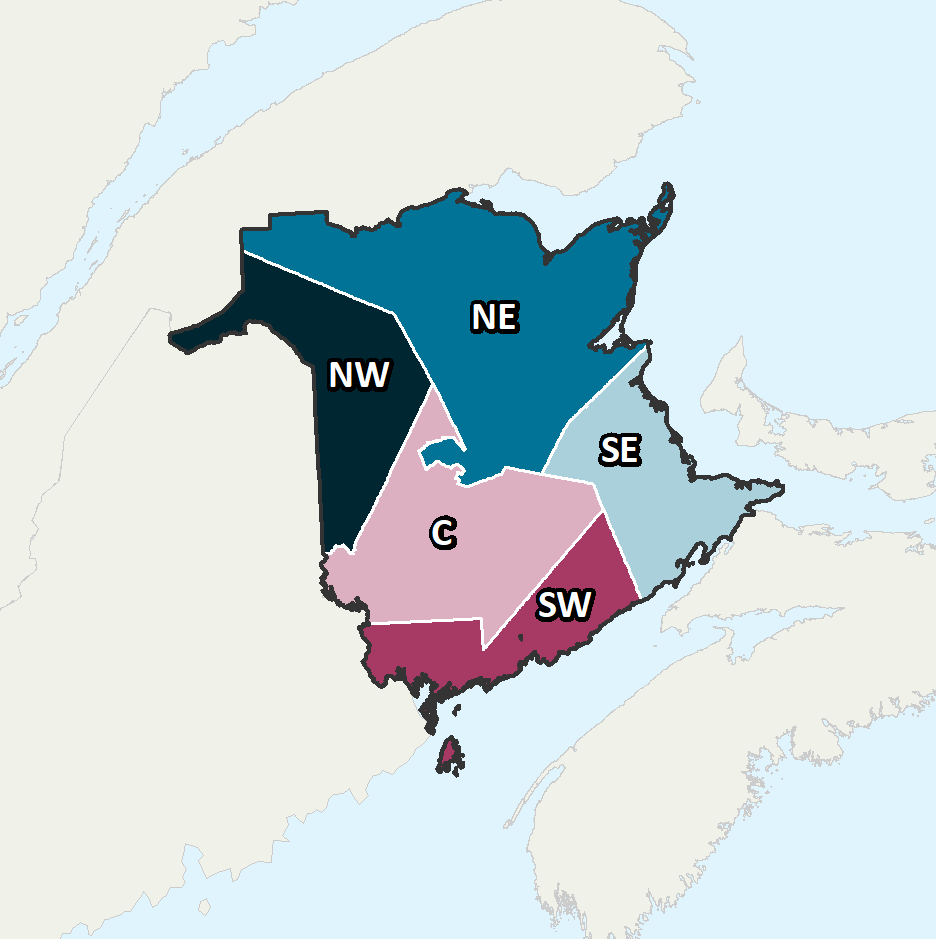
    Province of New Brunswick Economic Regions

    Economic Regions

    The following map displays New Brunswick’s five economic regions. An economic region (ER) is a grouping of counties, created as a standard unit for analysis of regional economic activity across Canada.

    Annual Average Salary by Economic Regions

    The following graph shows the average salary of all persons employed in this occupation in each of New Brunswick’s five economic regions.

    Data legend

    N/A
    Northeast
    N/A
    Southeast
    $95,000
    Southwest
    $90,000
    Central
    N/A
    Northwest
    Province of New Brunswick Economic Regions

    Economic Regions

    The following map displays New Brunswick’s five economic regions. An economic region (ER) is a grouping of counties, created as a standard unit for analysis of regional economic activity across Canada.

    Hourly Median Wages by Economic Regions

    The following represents the median hourly wage of all persons employed in this occupation in each of New Brunswick’s five economic regions.

    No Data Available
    Salary

    The following shows the average salary of everyone who worked full-time and year-round in this occupation across each of the Atlantic Provinces and nationally.

    New Brunswick

    $84,000

    Newfoundland

    $118,000

    Prince Edward Island

    N/A

    Nova Scotia

    $80,000

    Canada

    $110,000
    Employment Outlook

    The following represents the number of job openings that are expected to occur in this occupation over the next three and ten years respectively, broken down by openings expected to result from growth (“new jobs”) and openings expected to result from attrition (death and retirements).

    Three Year Outlook

    Total Openings: 3-Year

    7
     

    New Jobs: 3-Year

    -1
     

    Retirements/Deaths: 3-Year

    8
     

    Ten Year Outlook

    Total Openings: 10-Year

    21
     

    New Jobs: 10-Year

    -7
     

    Retirements/Deaths: 10-Year

    29