Restaurant and food service managers

Restaurant and food service managers

NOC
60030

manage and evaluate the operations of restaurants, bars, cafeterias and other food and beverage services.

Quick facts

3-Year Outlook

Good
Good

3-Year Job Openings

481
 

Median Hourly Wage

$19.23
$15.50
Low
$28.50
High

Average Salary

$50,480
 

Typically Required

College or apprenticeship

Employed

2,843
 
Job details

Full NOC Description

Restaurant and food service managers plan, organize, direct, control and evaluate the operations of restaurants, bars, cafeterias and other food and beverage services. They are employed in food and beverage service establishments, or they may be self-employed.

Main Duties

This group performs some or all of the following duties:
  • Plan, organize, direct, control and evaluate the operations of a restaurant, bar, cafeteria or other food or beverage service
  • Determine type of services to be offered and implement operational procedures
  • Recruit staff and oversee staff training
  • Set staff work schedules and monitor staff performance
  • Control inventory, monitor revenues and modify procedures and prices
  • Resolve customer complaints and ensure health and safety regulations are followed
  • Negotiate arrangements with suppliers for food and other supplies
  • Negotiate arrangements with clients for catering or use of facilities for banquets or receptions.
  • Also Known As

    • banquet manager
    • bar manager
    • cafeteria manager
    • catering service manager
    • dining room manager
    • food services manager
    • hotel food and beverage service manager
    • restaurant assistant manager
    • restaurant manager
    • restaurateur - food services
    Requirements

    Employment Requirements

    Completion of a college or other program related to hospitality or food and beverage service management is usually required.
  • Several years of experience in the food service sector, including supervisory experience, are required.
  • Responsible beverage service certification is usually required for managers of establishments serving alcoholic beverages.
  • Provincial Regulation

    Not Provincially Regulated

    Employment by Sex

    The following graph shows the percentage of men and women working in this occupation in New Brunswick.

    Data legend

    50.3%
    Female
    49.7%
    Male
    Employment by age

    The following graph shows the breakdown of all persons working in this occupation in New Brunswick by age group.

    Data legend

    4.4%
    15-24
    17.9%
    25-34
    22.7%
    35-44
    27.2%
    45-54
    22.7%
    55-64
    5.1%
    65+
    Employment by highest level of education

    The following graph shows the breakdown of all persons working in this occupation in New Brunswick by highest level of education achieved.

    Data legend

    10.8%
    No Certificate, Diploma or Degree
    38.5%
    High School, Diploma or Equivalent
    8.3%
    Apprenticeship or Trades Certificate or Diploma
    26.5%
    College or University Below Bachelor Level
    15.9%
    University - Bachelor Level or Above
    Employment by Industry

    The following graph shows the industry groups in which the largest shares of persons working in this occupation in New Brunswick are employed. Small percentages for all top three industry groups may suggest employment for this occupation is widely distributed amongst many industry groups.

    Data legend

    84.6%
    Accommodation and food services
    4.6%
    Arts, entertainment and recreation
    2.3%
    Agriculture, forestry, fishing and hunting
    8.5%
    All Other Industries
    Employment by Economic Regions

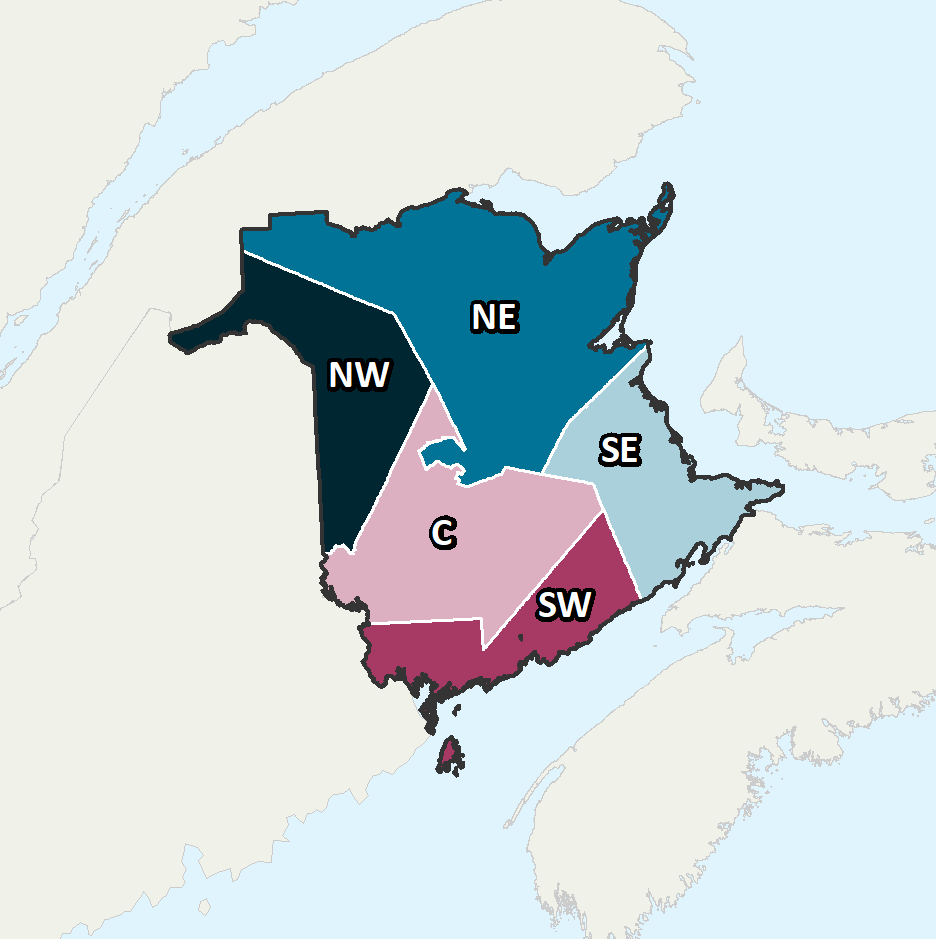
    The following graph shows the breakdown of all persons employed in this occupation in New Brunswick by which economic region they reside in.

    Data legend
    27.40%
    Northeast
    29.50%
    Southeast
    16.10%
    Southwest
    16.20%
    Central
    10.80%
    Northwest
    Province of New Brunswick Economic Regions

    Economic Regions

    The following map displays New Brunswick’s five economic regions. An economic region (ER) is a grouping of counties, created as a standard unit for analysis of regional economic activity across Canada.

    Annual Average Salary by Economic Regions

    The following graph shows the average salary of all persons employed in this occupation in each of New Brunswick’s five economic regions.

    Data legend

    $51,000
    Northeast
    $52,800
    Southeast
    $46,000
    Southwest
    $52,000
    Central
    $49,600
    Northwest
    Province of New Brunswick Economic Regions

    Economic Regions

    The following map displays New Brunswick’s five economic regions. An economic region (ER) is a grouping of counties, created as a standard unit for analysis of regional economic activity across Canada.

    Hourly Median Wages by Economic Regions

    The following represents the median hourly wage of all persons employed in this occupation in each of New Brunswick’s five economic regions.

    Northeast

    $19.23
    $15.50
    Low
    $28.50
    High

    Southeast

    $19.23
    $15.30
    Low
    $28.50
    High

    Southwest

    $19.23
    $15.50
    Low
    $28.50
    High
    No Data Available

    Northwest

    $19.23
    $15.50
    Low
    $28.50
    High
    Salary

    The following shows the average salary of everyone who worked full-time and year-round in this occupation across each of the Atlantic Provinces and nationally.

    New Brunswick

    $50,480

    Newfoundland

    $54,400

    Prince Edward Island

    $45,600

    Nova Scotia

    $46,360

    Canada

    $52,000
    Employment Outlook

    The following represents the number of job openings that are expected to occur in this occupation over the next three and ten years respectively, broken down by openings expected to result from growth (“new jobs”) and openings expected to result from attrition (death and retirements).

    Three Year Outlook

    Total Openings: 3-Year

    481
     

    New Jobs: 3-Year

    270
     

    Retirements/Deaths: 3-Year

    211
     

    Ten Year Outlook

    Total Openings: 10-Year

    1,226
     

    New Jobs: 10-Year

    394
     

    Retirements/Deaths: 10-Year

    834