Home support workers, caregivers and related

NOC
44101

- Home support workers, caregivers and related occupations

provide personal care and companionship for seniors, persons with disabilities and convalescent clients. They provide care in the client's residence, where they may also reside.

Quick facts

3-Year Outlook

Good
Good

3-Year Job Openings

560
 

Median Hourly Wage

$15.50
$15.30
Low
$18.00
High

Average Salary

$33,000
 

Typically Required

High school / on-the-job training

Employed

2,398
 
Job details

Full NOC Description

Home support workers, caregivers and related occupations, provide personal care and companionship for seniors, persons with disabilities and convalescent clients. They provide care in the client's residence, where they may also reside. They are employed by home care and support agencies, private households, or they may be self-employed.

Main Duties

This group performs some or all of the following duties:
  • Provide care and companionship for individuals and families during periods of incapacitation, convalescence or family disruption
  • Administer bedside and personal care to clients such as aid in ambulation, bathing, personal hygiene, and dressing and undressing
  • Plan and prepare meals and special diets, and feed or assist in feeding clients
  • May perform routine health-related duties such as changing non-sterile dressings, assisting in the administration of medications and collecting specimens under the general direction of home care agency supervisor or nurse
  • May perform routine housekeeping duties such as laundry, washing dishes and making beds.
  • Also Known As

    • personal support worker (PSW) - home support
    • attendant for persons with disabilities - home care
    • family caregiver
    • home support worker
    • live-in caregiver
    • live-in caregiver - seniors
    • personal aide - home support
    • personal care attendant - home care
    • respite worker - home support
    Requirements

    Employment Requirements

    Some secondary school education is usually required.
  • Home management experience may be required.
  • College or other courses in home support may be required.
  • First aid certification may be required.
  • Completion of a training program in care of the elderly, care of persons with disabilities, convalescent care or in a related field may be required.
  • Provincial Regulation

    Not Provincially Regulated

    Employment by Sex

    The following graph shows the percentage of men and women working in this occupation in New Brunswick.

    Data legend

    92.4%
    Female
    7.6%
    Male
    Employment by age

    The following graph shows the breakdown of all persons working in this occupation in New Brunswick by age group.

    Data legend

    9.1%
    15-24
    12.7%
    25-34
    10.2%
    35-44
    18.9%
    45-54
    38.0%
    55-64
    11.0%
    65+
    Employment by highest level of education

    The following graph shows the breakdown of all persons working in this occupation in New Brunswick by highest level of education achieved.

    Data legend

    16.7%
    No Certificate, Diploma or Degree
    36.5%
    High School, Diploma or Equivalent
    9.7%
    Apprenticeship or Trades Certificate or Diploma
    30.1%
    College or University Below Bachelor Level
    7.0%
    University - Bachelor Level or Above
    Employment by Industry

    The following graph shows the industry groups in which the largest shares of persons working in this occupation in New Brunswick are employed. Small percentages for all top three industry groups may suggest employment for this occupation is widely distributed amongst many industry groups.

    Data legend

    90.9%
    Health care and social assistance
    4.2%
    Other services (except public administration)
    1.3%
    Administrative and support, waste management and remediation services
    3.6%
    All Other Industries
    Employment by Economic Regions

    The following graph shows the breakdown of all persons employed in this occupation in New Brunswick by which economic region they reside in.

    Data legend
    25.40%
    Northeast
    18.20%
    Southeast
    23.30%
    Southwest
    17.40%
    Central
    15.70%
    Northwest
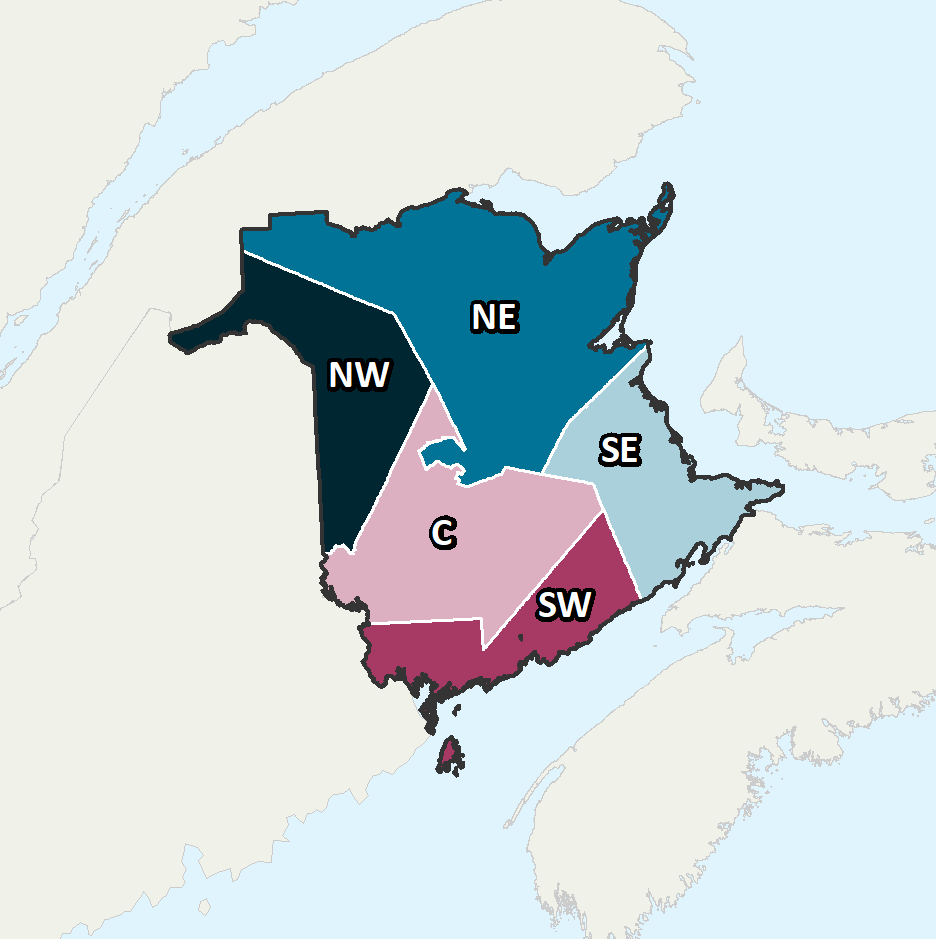
    Province of New Brunswick Economic Regions

    Economic Regions

    The following map displays New Brunswick’s five economic regions. An economic region (ER) is a grouping of counties, created as a standard unit for analysis of regional economic activity across Canada.

    Annual Average Salary by Economic Regions

    The following graph shows the average salary of all persons employed in this occupation in each of New Brunswick’s five economic regions.

    Data legend

    $31,200
    Northeast
    $35,200
    Southeast
    $33,600
    Southwest
    $36,500
    Central
    $29,600
    Northwest
    Province of New Brunswick Economic Regions

    Economic Regions

    The following map displays New Brunswick’s five economic regions. An economic region (ER) is a grouping of counties, created as a standard unit for analysis of regional economic activity across Canada.

    Hourly Median Wages by Economic Regions

    The following represents the median hourly wage of all persons employed in this occupation in each of New Brunswick’s five economic regions.

    Northeast

    $15.50
    $15.30
    Low
    $17.00
    High

    Southeast

    $15.31
    $15.30
    Low
    $17.50
    High

    Southwest

    $15.50
    $15.30
    Low
    $20.00
    High

    Central

    $15.00
    $15.30
    Low
    $18.00
    High

    Northwest

    $15.50
    $15.30
    Low
    $16.80
    High
    Salary

    The following shows the average salary of everyone who worked full-time and year-round in this occupation across each of the Atlantic Provinces and nationally.

    New Brunswick

    $33,000

    Newfoundland

    $33,960

    Prince Edward Island

    $43,000

    Nova Scotia

    $40,000

    Canada

    $41,640
    Employment Outlook

    The following represents the number of job openings that are expected to occur in this occupation over the next three and ten years respectively, broken down by openings expected to result from growth (“new jobs”) and openings expected to result from attrition (death and retirements).

    Three Year Outlook

    Total Openings: 3-Year

    560
     

    New Jobs: 3-Year

    240
     

    Retirements/Deaths: 3-Year

    320
     

    Ten Year Outlook

    Total Openings: 10-Year

    1,309
     

    New Jobs: 10-Year

    445
     

    Retirements/Deaths: 10-Year

    863