Operations members of the Canadian Armed Forces

Operations members of the Canadian Armed Forces

NOC
43204

provide operational support to soldiers including the proper functioning and testing of military equipment such as vehicles, ships and weapons.

Quick facts

3-Year Outlook

Undetermined
Undetermined

3-Year Job Openings

262
 

Median Hourly Wage

$28.94
$24.54
Low
$35.43
High

Average Salary

$68,400
 

Typically Required

High school / on-the-job training

Employed

2,006
 
Job details

Full NOC Description

Operations members of the Canadian Armed Forces provide operational support to soldiers including the proper functioning and testing of military equipment such as vehicles, ships and weapons. They follow the military and strategic policies established by the leadership of the Canadian Army, the Royal Canadian Airforce and the Royal Canadian Navy.

Main Duties

This group performs some or all of the following duties:
  • Analyze equipment and system performance on all combat information equipment
  • Maintain and operate engineering equipment, including weapons, vehicles, heavy equipment and supplies
  • Inspect motors in operation, road test motor vehicles, and test automotive systems and components using computerized diagnostic and other testing devices to diagnose and isolate faults
  • Configure and operate intelligence, surveillance and recognizance systems
  • Oversee the construction of tools and devices to enable infantry soldiers to cross natural and man-made obstacles and break through enemy defenses
  • Operate weapons and missile related equipment for defense.
  • Also Known As

    • airborne electronic sensor operator
    • assault pioneer
    • combat engineer
    • naval combat information operator
    • sonar operator
    Requirements

    Employment Requirements

    Completion of secondary school is required.
  • Three months of basic military training is required and provided.
  • Occupational qualification training of at least six months is required.
  • Specialized training in the operation and maintenance of military equipment and systems is provided.
  • Provincial Regulation

    Not Provincially Regulated

    Employment by Sex

    The following graph shows the percentage of men and women working in this occupation in New Brunswick.

    Data legend

    7.7%
    Female
    92.3%
    Male
    Employment by age

    The following graph shows the breakdown of all persons working in this occupation in New Brunswick by age group.

    Data legend

    13.2%
    15-24
    44.4%
    25-34
    26.8%
    35-44
    12.1%
    45-54
    3.4%
    55-64
    0.2%
    65+
    Employment by highest level of education

    The following graph shows the breakdown of all persons working in this occupation in New Brunswick by highest level of education achieved.

    Data legend

    6.6%
    No Certificate, Diploma or Degree
    61.2%
    High School, Diploma or Equivalent
    7.2%
    Apprenticeship or Trades Certificate or Diploma
    19.7%
    College or University Below Bachelor Level
    5.3%
    University - Bachelor Level or Above
    Employment by Industry

    The following graph shows the industry groups in which the largest shares of persons working in this occupation in New Brunswick are employed. Small percentages for all top three industry groups may suggest employment for this occupation is widely distributed amongst many industry groups.

    Data legend

    98.7%
    Public administration
    N/A
    N/A
    N/A
    N/A
    1.3%
    All Other Industries
    Employment by Economic Regions

    The following graph shows the breakdown of all persons employed in this occupation in New Brunswick by which economic region they reside in.

    Data legend
    2.50%
    Northeast
    4.00%
    Southeast
    4.70%
    Southwest
    87.90%
    Central
    0.80%
    Northwest
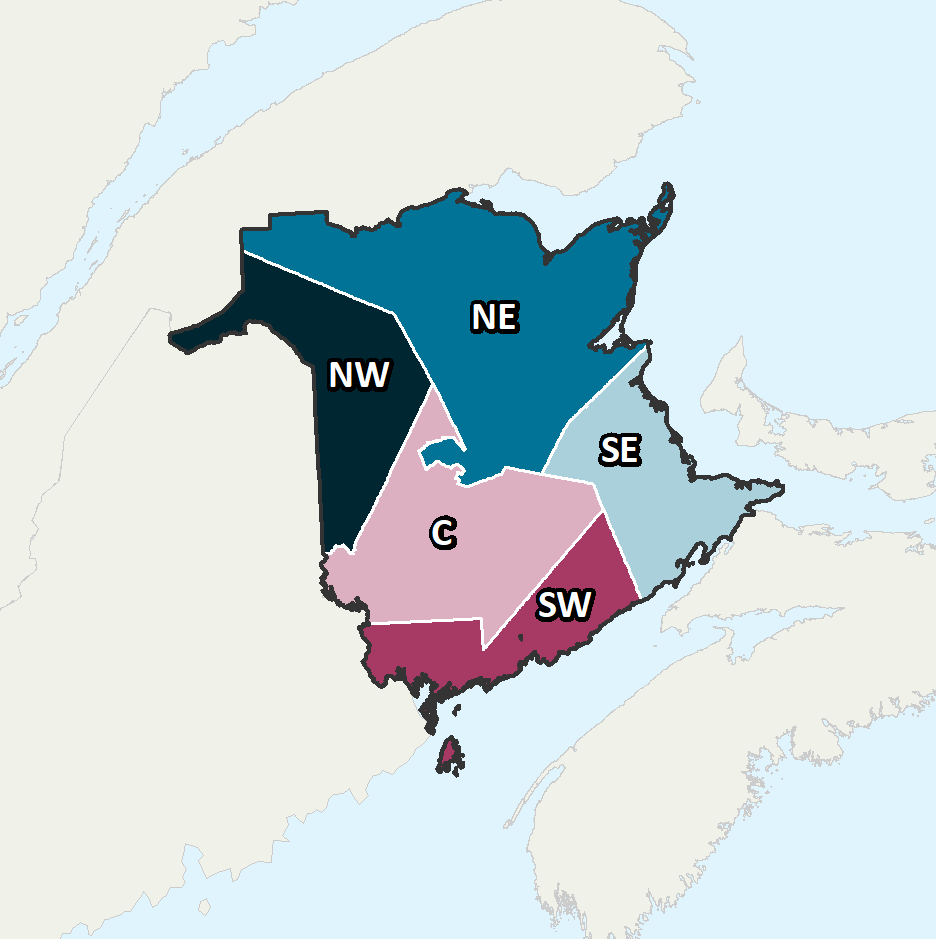
    Province of New Brunswick Economic Regions

    Economic Regions

    The following map displays New Brunswick’s five economic regions. An economic region (ER) is a grouping of counties, created as a standard unit for analysis of regional economic activity across Canada.

    Annual Average Salary by Economic Regions

    The following graph shows the average salary of all persons employed in this occupation in each of New Brunswick’s five economic regions.

    Data legend

    $60,000
    Northeast
    $68,000
    Southeast
    $72,000
    Southwest
    $68,700
    Central
    N/A
    Northwest
    Province of New Brunswick Economic Regions

    Economic Regions

    The following map displays New Brunswick’s five economic regions. An economic region (ER) is a grouping of counties, created as a standard unit for analysis of regional economic activity across Canada.

    Hourly Median Wages by Economic Regions

    The following represents the median hourly wage of all persons employed in this occupation in each of New Brunswick’s five economic regions.

    No Data Available

    Southeast

    $34.22
    $0.00
    Low
    $0.00
    High

    Southwest

    $27.80
    $0.00
    Low
    $0.00
    High

    Central

    $29.10
    $25.00
    Low
    $35.35
    High
    No Data Available
    Salary

    The following shows the average salary of everyone who worked full-time and year-round in this occupation across each of the Atlantic Provinces and nationally.

    New Brunswick

    $68,400

    Newfoundland

    $73,500

    Prince Edward Island

    $80,000

    Nova Scotia

    $76,500

    Canada

    $77,100
    Employment Outlook

    The following represents the number of job openings that are expected to occur in this occupation over the next three and ten years respectively, broken down by openings expected to result from growth (“new jobs”) and openings expected to result from attrition (death and retirements).

    Three Year Outlook

    Total Openings: 3-Year

    262
     

    New Jobs: 3-Year

    220
     

    Retirements/Deaths: 3-Year

    42
     

    Ten Year Outlook

    Total Openings: 10-Year

    697
     

    New Jobs: 10-Year

    480
     

    Retirements/Deaths: 10-Year

    218