Drafting technologists and technicians

Drafting technologists and technicians

NOC
22212

may work independently or assist engineers, architects or industrial designers by preparing drawings and related technical information such as building information models (BIM).

Quick facts

3-Year Outlook

Limited
Limited

3-Year Job Openings

91
 

Median Hourly Wage

$30.77
$25.00
Low
$44.33
High

Average Salary

$52,400
 

Typically Required

College or apprenticeship

Employed

497
 
Job details

Full NOC Description

Drafting technologists and technicians prepare engineering designs, drawings and related technical information, such as building information models (BIM), in multidisciplinary engineering teams or in support of engineers, architects or industrial designers, or they may work independently. They are employed by consulting and construction companies, utility, resource and manufacturing companies, all levels of government and by a wide range of other establishments.

Main Duties

This group performs some or all of the following duties:
  • Drafting technologists
  • Develop and prepare engineering designs and drawings from preliminary concepts, sketches, engineering calculations, specification sheets and other data
  • Create building information models (BIM), using computer software, to provide digital representations of physical and functional aspects of buildings and other engineering projects
  • Operate computer-assisted design (CAD) and drafting workstations
  • Develop and prepare design sketches
  • Complete documentation packages and produce drawing sets
  • Check and verify design drawings to conform to specifications and design data
  • Write technical reports
  • Prepare contracts and tender documents
  • Prepare construction specifications, costs and material estimates
  • Supervise and train other technologists, technicians and drafters.
  • Drafting technicians
  • Develop and prepare engineering drawings, plans, diagrams or layouts from sketches
  • Operate computer-assisted drafting equipment or a conventional drafting station.
  • Also Known As

    • architectural draftsperson
    • building information modelling (BIM) technologist
    • computer-aided design and drafting (CADD) technologist
    • computer-assisted drafting (CAD) technician
    • design and drafting technologist
    • drafting office supervisor
    • drafting technician
    • drafting technologist
    • draftsperson
    • electrical draftsperson
    • electromechanical draftsperson
    • electronic draftsperson
    • engineering design and drafting technologist
    • mechanical draftsperson
    • steel detailer - drafting
    • structural draftsperson
    • structural steel drafter-detailer
    Requirements

    Employment Requirements

    Completion of secondary school is usually required.
  • Completion of a two- to three-year college program in engineering design and drafting technology or in a related field is usually required for drafting and design technologists.
  • Completion of a one- to two-year college program in drafting or completion of a three- to four-year apprenticeship program or four to five years of related experience plus completion of college or industry courses in drafting are usually required for drafting technicians.
  • Trade certification for draftspersons is available, but voluntary in Ontario.
  • Certification in engineering design and drafting technology or in a related field through provincial associations of engineering/applied science technologists and technicians may be required by employers.
  • A period of supervised work experience, usually two years, is required before certification.
  • Provincial Regulation

    • Provincially Regulated: Yes
    Employment by Sex

    The following graph shows the percentage of men and women working in this occupation in New Brunswick.

    Data legend

    21.4%
    Female
    78.6%
    Male
    Employment by age

    The following graph shows the breakdown of all persons working in this occupation in New Brunswick by age group.

    Data legend

    7.2%
    15-24
    19.3%
    25-34
    28.9%
    35-44
    20.5%
    45-54
    20.5%
    55-64
    3.6%
    65+
    Employment by highest level of education

    The following graph shows the breakdown of all persons working in this occupation in New Brunswick by highest level of education achieved.

    Data legend

    0.0%
    No Certificate, Diploma or Degree
    13.3%
    High School, Diploma or Equivalent
    4.8%
    Apprenticeship or Trades Certificate or Diploma
    67.5%
    College or University Below Bachelor Level
    14.5%
    University - Bachelor Level or Above
    Employment by Industry

    The following graph shows the industry groups in which the largest shares of persons working in this occupation in New Brunswick are employed. Small percentages for all top three industry groups may suggest employment for this occupation is widely distributed amongst many industry groups.

    Data legend

    49.4%
    Professional, scientific and technical services
    32.5%
    Manufacturing
    12.0%
    Construction
    6.0%
    All Other Industries
    Employment by Economic Regions

    The following graph shows the breakdown of all persons employed in this occupation in New Brunswick by which economic region they reside in.

    Data legend
    12.00%
    Northeast
    37.30%
    Southeast
    16.90%
    Southwest
    20.50%
    Central
    13.30%
    Northwest
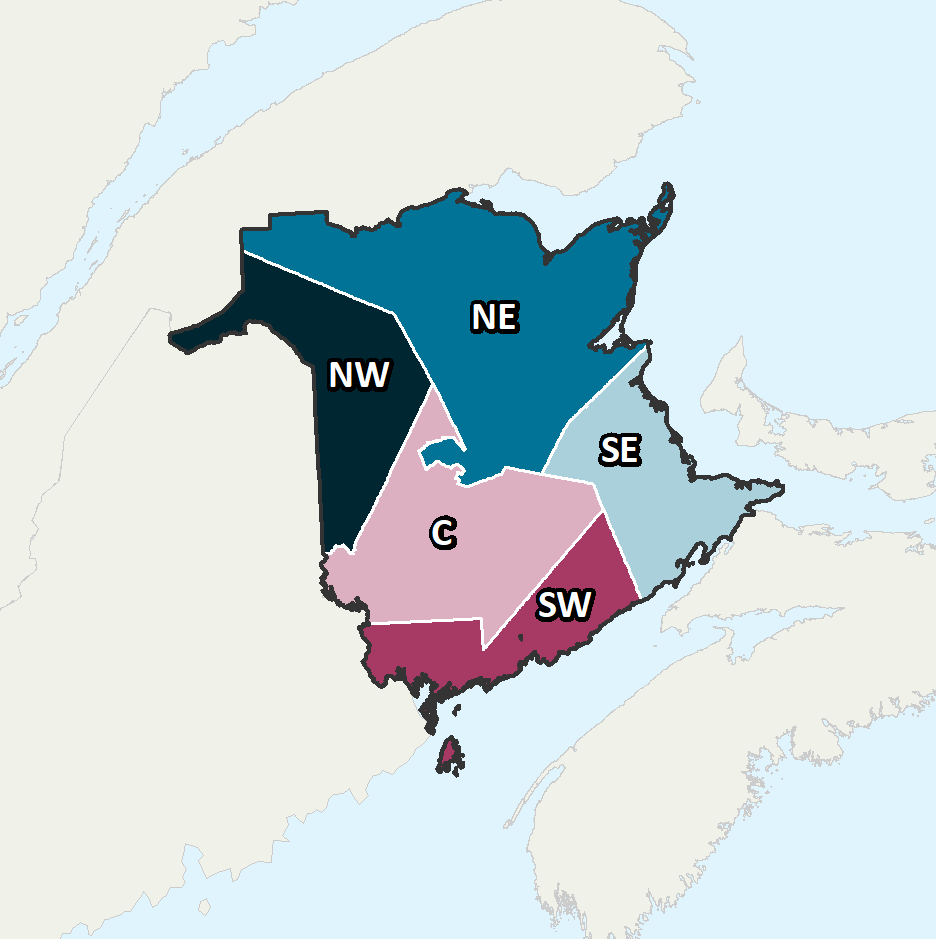
    Province of New Brunswick Economic Regions

    Economic Regions

    The following map displays New Brunswick’s five economic regions. An economic region (ER) is a grouping of counties, created as a standard unit for analysis of regional economic activity across Canada.

    Annual Average Salary by Economic Regions

    The following graph shows the average salary of all persons employed in this occupation in each of New Brunswick’s five economic regions.

    Data legend

    $64,000
    Northeast
    $50,000
    Southeast
    $48,000
    Southwest
    $52,000
    Central
    $54,000
    Northwest
    Province of New Brunswick Economic Regions

    Economic Regions

    The following map displays New Brunswick’s five economic regions. An economic region (ER) is a grouping of counties, created as a standard unit for analysis of regional economic activity across Canada.

    Hourly Median Wages by Economic Regions

    The following represents the median hourly wage of all persons employed in this occupation in each of New Brunswick’s five economic regions.

    Northeast

    $26.21
    $20.16
    Low
    $36.80
    High

    Southeast

    $30.77
    $25.00
    Low
    $44.33
    High

    Southwest

    $27.11
    $19.34
    Low
    $35.91
    High

    Central

    $30.77
    $25.00
    Low
    $44.33
    High

    Northwest

    $30.77
    $25.00
    Low
    $44.33
    High
    Salary

    The following shows the average salary of everyone who worked full-time and year-round in this occupation across each of the Atlantic Provinces and nationally.

    New Brunswick

    $52,400

    Newfoundland

    $74,000

    Prince Edward Island

    $52,000

    Nova Scotia

    $55,400

    Canada

    $65,700
    Employment Outlook

    The following represents the number of job openings that are expected to occur in this occupation over the next three and ten years respectively, broken down by openings expected to result from growth (“new jobs”) and openings expected to result from attrition (death and retirements).

    Three Year Outlook

    Total Openings: 3-Year

    91
     

    New Jobs: 3-Year

    51
     

    Retirements/Deaths: 3-Year

    39
     

    Ten Year Outlook

    Total Openings: 10-Year

    196
     

    New Jobs: 10-Year

    64
     

    Retirements/Deaths: 10-Year

    130