Employment insurance and revenue officers

Employment insurance and revenue officers

NOC
12104

administer and enforce laws and regulations related to, tax revenue, employment insurance and other government benefit services.

Quick facts

3-Year Outlook

Moderate
Moderate

3-Year Job Openings

168
 

Median Hourly Wage

$30.19
$22.00
Low
$44.62
High

Average Salary

$60,800
 

Typically Required

College or apprenticeship

Employed

922
 
Job details

Full NOC Description

Employment insurance and revenue officers administer and enforce laws and regulations related to tax revenue, employment insurance and other government benefit services. They are employed by government agencies.

Main Duties

This group performs some or all of the following duties:
  • Excise tax revenue officers
  • Audit accounting records to determine income, exemptions, payable taxes, compliance with reporting regulations and existence of fraud
  • Examine accounting systems and internal controls of organizations
  • Provide advice on reporting and evaluation methods for goods subject to taxation
  • Prepare briefs and assist in searching and seizing records, and in preparing charges for court cases.
  • Government benefits services officers
  • Determine the eligibility of persons applying for government benefits such as Employment Insurance (EI), Canada Pension Plan (CPP) and Old Age Security (OAS)
  • Ascertain the facts on such issues as reasons for loss of employment and availability for work
  • Monitor the payments of benefits and investigate claimants when there appears to be fraud or abuse.
  • Also Known As

    • employment insurance agent
    • employment insurance benefits control officer
    • revenue officer
    • tax collection officer
    • tax enforcement officer
    Requirements

    Employment Requirements

    A bachelor's degree or college diploma is usually required.
  • Several years of related administrative or regulatory experience may be required.
  • Completion of specialized government training is required.
  • Provincial Regulation

    Not Provincially Regulated

    Employment by Sex

    The following graph shows the percentage of men and women working in this occupation in New Brunswick.

    Data legend

    69.8%
    Female
    30.2%
    Male
    Employment by age

    The following graph shows the breakdown of all persons working in this occupation in New Brunswick by age group.

    Data legend

    4.7%
    15-24
    24.7%
    25-34
    30.7%
    35-44
    25.1%
    45-54
    13.5%
    55-64
    1.4%
    65+
    Employment by highest level of education

    The following graph shows the breakdown of all persons working in this occupation in New Brunswick by highest level of education achieved.

    Data legend

    0.5%
    No Certificate, Diploma or Degree
    17.7%
    High School, Diploma or Equivalent
    3.3%
    Apprenticeship or Trades Certificate or Diploma
    44.7%
    College or University Below Bachelor Level
    34.0%
    University - Bachelor Level or Above
    Employment by Industry

    The following graph shows the industry groups in which the largest shares of persons working in this occupation in New Brunswick are employed. Small percentages for all top three industry groups may suggest employment for this occupation is widely distributed amongst many industry groups.

    Data legend

    99.1%
    Public administration
    N/A
    N/A
    N/A
    N/A
    0.9%
    All Other Industries
    Employment by Economic Regions

    The following graph shows the breakdown of all persons employed in this occupation in New Brunswick by which economic region they reside in.

    Data legend
    37.70%
    Northeast
    26.00%
    Southeast
    22.80%
    Southwest
    12.10%
    Central
    N/A
    Northwest
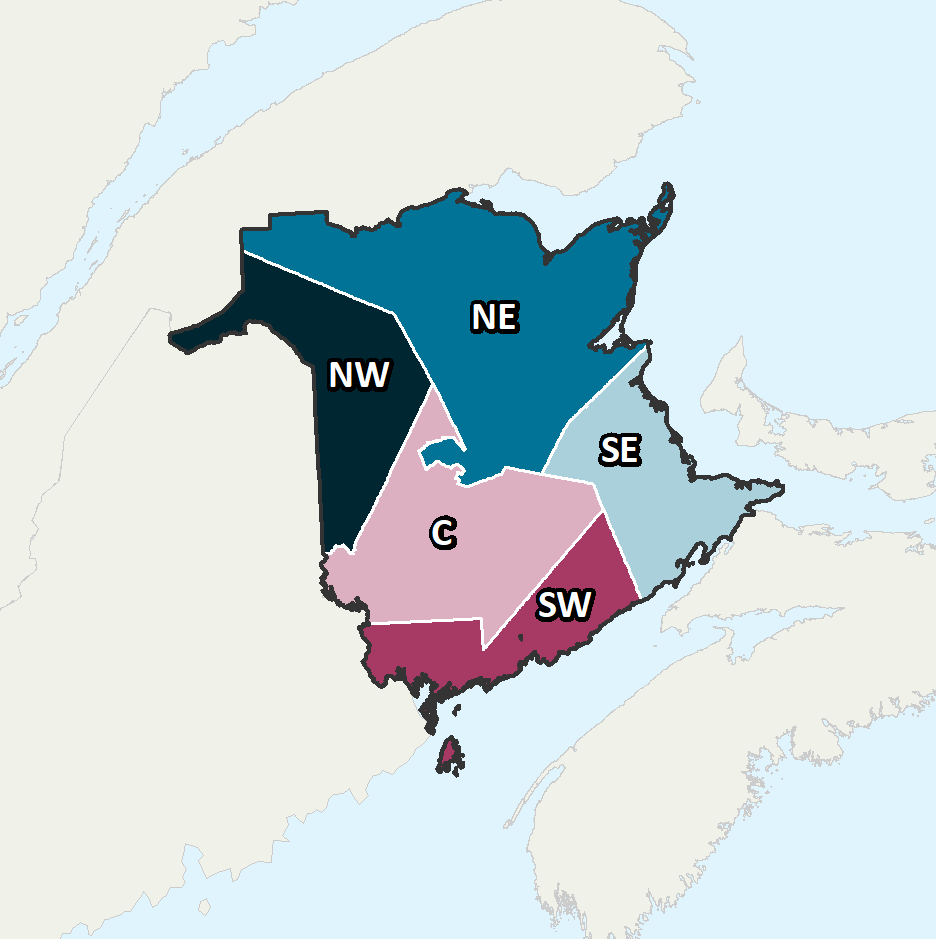
    Province of New Brunswick Economic Regions

    Economic Regions

    The following map displays New Brunswick’s five economic regions. An economic region (ER) is a grouping of counties, created as a standard unit for analysis of regional economic activity across Canada.

    Annual Average Salary by Economic Regions

    The following graph shows the average salary of all persons employed in this occupation in each of New Brunswick’s five economic regions.

    Data legend

    $57,200
    Northeast
    $62,000
    Southeast
    $66,000
    Southwest
    $59,000
    Central
    N/A
    Northwest
    Province of New Brunswick Economic Regions

    Economic Regions

    The following map displays New Brunswick’s five economic regions. An economic region (ER) is a grouping of counties, created as a standard unit for analysis of regional economic activity across Canada.

    Hourly Median Wages by Economic Regions

    The following represents the median hourly wage of all persons employed in this occupation in each of New Brunswick’s five economic regions.

    Northeast

    $28.38
    $25.64
    Low
    $33.65
    High

    Southeast

    $33.33
    $21.51
    Low
    $44.62
    High

    Southwest

    $33.33
    $22.67
    Low
    $46.28
    High

    Central

    $28.21
    $20.00
    Low
    $32.00
    High
    No Data Available
    Salary

    The following shows the average salary of everyone who worked full-time and year-round in this occupation across each of the Atlantic Provinces and nationally.

    New Brunswick

    $60,800

    Newfoundland

    $58,800

    Prince Edward Island

    $62,000

    Nova Scotia

    $64,000

    Canada

    $67,500
    Employment Outlook

    The following represents the number of job openings that are expected to occur in this occupation over the next three and ten years respectively, broken down by openings expected to result from growth (“new jobs”) and openings expected to result from attrition (death and retirements).

    Three Year Outlook

    Total Openings: 3-Year

    168
     

    New Jobs: 3-Year

    100
     

    Retirements/Deaths: 3-Year

    68
     

    Ten Year Outlook

    Total Openings: 10-Year

    527
     

    New Jobs: 10-Year

    215
     

    Retirements/Deaths: 10-Year

    311