Pest controllers

Pest controllers

NOC
73202

- Pest controllers and fumigators

inspect buildings and outside areas for pest infestation and apply treatments to kill harmful insects, rodents and other pests, or set cage traps to capture and remove animals.

Quick facts

3-Year Outlook

Undetermined
Undetermined

3-Year Job Openings

-4
 

Median Hourly Wage

$20.63
$0.00
Low
$0.00
High

Average Salary

$50,000
 

Typically Required

High school / on-the-job training

Employed

70
 
Job details

Full NOC Description

Pest controllers and fumigators inspect buildings and outside areas for pest infestation and spray chemical treatments to kill noxious and destructive insects, rodents and other pests or set cage traps to capture and remove animals. They are employed by pest control companies, or they may be self-employed.

Main Duties

This group performs some or all of the following duties:
  • Inspect buildings and outside areas at regular intervals or at specific request of property owner to detect signs of infestation
  • Determine type of treatment required and provide estimate of costs to clients
  • Prepare and spray chemical mixture on infested areas using mechanical or electric sprayer to kill insects, rodents and other pests
  • Fumigate households
  • Place and set traps to capture and remove animals, such as skunks or raccoons
  • Install animal control barriers such as needle strips, netting and other devices to keep animals off property
  • Clean out areas that harbour pests using rakes, shovels, brooms or mops
  • Advise clients on how to prevent pest infestation.
  • Also Known As

    • animal control trapper
    • pest control operator
    • pest control service representative
    • pest control technician
    • pest controller
    • pest exterminator
    • pest fumigator
    Requirements

    Employment Requirements

    Completion of secondary school is usually required.
  • Completion of courses in pest control or extermination or several months of on-the-job training are usually required.
  • Provincial pesticide applicator licence is required in all provinces.
  • Provincial Regulation

    Not Provincially Regulated

    Employment by Sex

    The following graph shows the percentage of men and women working in this occupation in New Brunswick.

    Data legend

    5.9%
    Female
    94.1%
    Male
    Employment by age

    The following graph shows the breakdown of all persons working in this occupation in New Brunswick by age group.

    Data legend

    0.0%
    15-24
    0.0%
    25-34
    0.0%
    35-44
    0.0%
    45-54
    0.0%
    55-64
    0.0%
    65+
    Employment by highest level of education

    The following graph shows the breakdown of all persons working in this occupation in New Brunswick by highest level of education achieved.

    Data legend

    0.0%
    No Certificate, Diploma or Degree
    70.6%
    High School, Diploma or Equivalent
    0.0%
    Apprenticeship or Trades Certificate or Diploma
    0.0%
    College or University Below Bachelor Level
    0.0%
    University - Bachelor Level or Above
    Employment by Industry

    The following graph shows the industry groups in which the largest shares of persons working in this occupation in New Brunswick are employed. Small percentages for all top three industry groups may suggest employment for this occupation is widely distributed amongst many industry groups.

    Data legend

    94.1%
    Administrative and support, waste management and remediation services
    N/A
    N/A
    N/A
    N/A
    5.9%
    All Other Industries
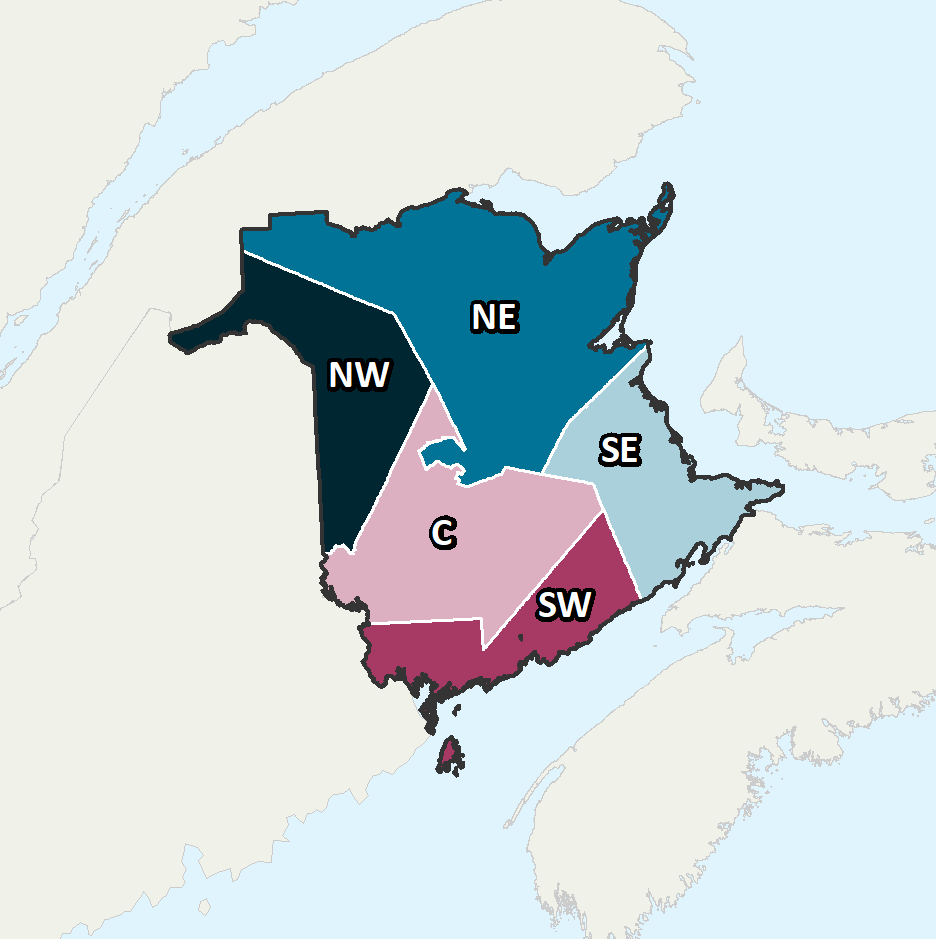
    Employment by Economic Regions

    The following graph shows the breakdown of all persons employed in this occupation in New Brunswick by which economic region they reside in.

    Data legend
    23.50%
    Northeast
    41.20%
    Southeast
    23.50%
    Southwest
    N/A
    Central
    N/A
    Northwest
    Province of New Brunswick Economic Regions

    Economic Regions

    The following map displays New Brunswick’s five economic regions. An economic region (ER) is a grouping of counties, created as a standard unit for analysis of regional economic activity across Canada.

    Annual Average Salary by Economic Regions

    The following graph shows the average salary of all persons employed in this occupation in each of New Brunswick’s five economic regions.

    Data legend

    N/A
    Northeast
    $52,000
    Southeast
    N/A
    Southwest
    N/A
    Central
    N/A
    Northwest
    Province of New Brunswick Economic Regions

    Economic Regions

    The following map displays New Brunswick’s five economic regions. An economic region (ER) is a grouping of counties, created as a standard unit for analysis of regional economic activity across Canada.

    Hourly Median Wages by Economic Regions

    The following represents the median hourly wage of all persons employed in this occupation in each of New Brunswick’s five economic regions.

    No Data Available
    Salary

    The following shows the average salary of everyone who worked full-time and year-round in this occupation across each of the Atlantic Provinces and nationally.

    New Brunswick

    $50,000

    Newfoundland

    $44,000

    Prince Edward Island

    N/A

    Nova Scotia

    $48,000

    Canada

    $55,400
    Employment Outlook

    The following represents the number of job openings that are expected to occur in this occupation over the next three and ten years respectively, broken down by openings expected to result from growth (“new jobs”) and openings expected to result from attrition (death and retirements).

    Three Year Outlook

    Total Openings: 3-Year

    -4
     

    New Jobs: 3-Year

    -5
     

    Retirements/Deaths: 3-Year

    2
     

    Ten Year Outlook

    Total Openings: 10-Year

    9
     

    New Jobs: 10-Year

    -4
     

    Retirements/Deaths: 10-Year

    10