Steamfitters, pipefitters and sprinkler system installers

Steamfitters, pipefitters and sprinkler system installers

NOC
72301

lay out, assemble, fabricate and maintain piping systems carrying water, steam, chemicals, fuel and other agents used in fire protection, heating, cooling, lubricating and other processes.

Quick facts

3-Year Outlook

Moderate
Moderate

3-Year Job Openings

59
 

Median Hourly Wage

$40.66
$25.00
Low
$46.30
High

Average Salary

$79,000
 

Typically Required

College or apprenticeship

Employed

438
 
Job details

Full NOC Description

Steamfitters and pipefitters lay out, assemble, fabricate, maintain, troubleshoot and repair piping systems carrying water, steam, chemicals and fuel in heating, cooling, lubricating and other process piping systems. Sprinkler system installers fabricate, install, test, maintain and repair water, foam, carbon dioxide and dry chemical sprinkler systems in buildings for fire protection purposes.

Main Duties

This group performs some or all of the following duties:
  • Steamfitters and pipefitters
  • Read and interpret drawings, blueprints and specifications to determine layout requirements
  • Cut openings for pipe in walls, floors and ceilings using hand or power tools or machines
  • Select type and size of pipe required
  • Measure, cut, thread and bend pipe to required shape using hand and power tools
  • Weld, braze, cement, solder and thread joints to join pipes and fabricate sections of piping system
  • Install supports, valves, piping and control systems
  • Test system for leaks using testing equipment
  • Clean and maintain pipe units and fittings and flush system
  • Remove and replace worn components and reactivate system
  • May prepare cost estimates for clients.
  • Sprinkler system installers
  • Read and interpret drawings, specifications and fire codes to determine layout requirements
  • Install clamps, brackets and hangers to support piping system and sprinkler and fire protection equipment, using hand and power tools
  • Select, measure, cut, ream and thread pipe, install sprinkler heads and mount prepared pipe in supports
  • Join pipes and piping sections using soldering and welding equipment
  • Connect piping system to water mains, supply tanks, pumps, compressors and control equipment
  • Installs valves, alarms and associated equipment
  • Test system for leaks using air or liquid pressure equipment
  • Service and repair sprinkler system
  • May prepare cost estimates for clients.
  • Also Known As

    • apprentice pipefitter-steamfitter
    • fire protection mechanic
    • fire sprinkler fitter
    • marine pipefitter
    • pipefitter
    • sprinkler system fitter
    • sprinkler system installer
    • steamfitter
    • steamfitter-pipefitter
    Requirements

    Employment Requirements

    Completion of secondary school is usually required.
  • Completion of a four- to five-year apprenticeship program or A combination of over five years of work experience in the trade and some high school, college or industry courses in steamfitting, pipefitting or sprinkler system installation is usually required to be eligible for trade certification.
  • Steamfitter-pipefitter trade certification is compulsory in Nova Scotia, Prince Edward Island, New Brunswick, Quebec, Ontario, Manitoba and Alberta and available, but voluntary, in all other provinces and the territories.
  • Steamfitter-pipefitter (non-construction) trade certification is compulsory in Quebec.
  • Sprinkler system installer trade certification is compulsory in Nova Scotia, New Brunswick, Quebec and Manitoba and available, but voluntary, in all other provinces and the territories.
  • Sprinkler system installer (non-construction) trade certification is compulsory in Quebec.
  • Red Seal endorsement is also available to qualified steamfitters-pipefitters and sprinkler system installers upon successful completion of the interprovincial Red Seal examination.
  • Provincial Regulation

    • Provincially Regulated: Yes
    • Compulsory: Yes
    • Red Seal: Yes

    Regulation Body

    Employment by Sex

    The following graph shows the percentage of men and women working in this occupation in New Brunswick.

    Data legend

    2.6%
    Female
    97.4%
    Male
    Employment by age

    The following graph shows the breakdown of all persons working in this occupation in New Brunswick by age group.

    Data legend

    11.4%
    15-24
    20.3%
    25-34
    24.1%
    35-44
    16.5%
    45-54
    19.0%
    55-64
    8.9%
    65+
    Employment by highest level of education

    The following graph shows the breakdown of all persons working in this occupation in New Brunswick by highest level of education achieved.

    Data legend

    5.1%
    No Certificate, Diploma or Degree
    9.0%
    High School, Diploma or Equivalent
    57.7%
    Apprenticeship or Trades Certificate or Diploma
    28.2%
    College or University Below Bachelor Level
    0.0%
    University - Bachelor Level or Above
    Employment by Industry

    The following graph shows the industry groups in which the largest shares of persons working in this occupation in New Brunswick are employed. Small percentages for all top three industry groups may suggest employment for this occupation is widely distributed amongst many industry groups.

    Data legend

    63.6%
    Construction
    26.0%
    Manufacturing
    N/A
    N/A
    10.4%
    All Other Industries
    Employment by Economic Regions

    The following graph shows the breakdown of all persons employed in this occupation in New Brunswick by which economic region they reside in.

    Data legend
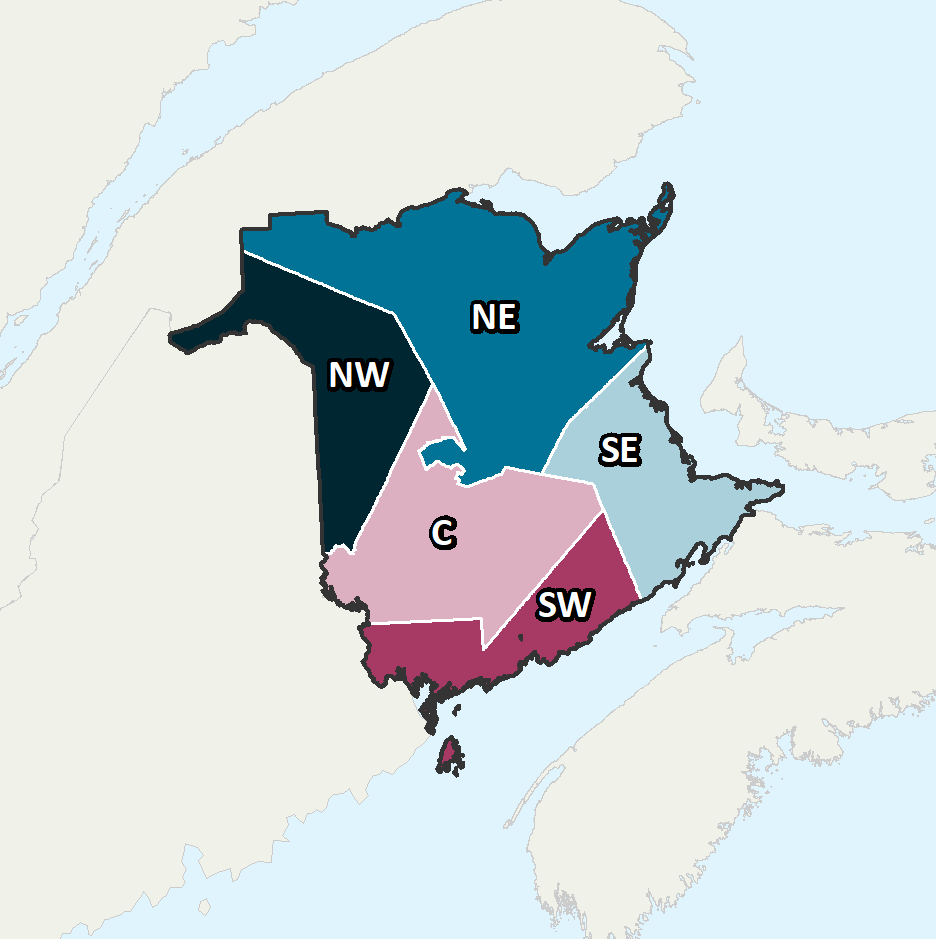
    16.90%
    Northeast
    19.50%
    Southeast
    42.90%
    Southwest
    11.70%
    Central
    9.10%
    Northwest
    Province of New Brunswick Economic Regions

    Economic Regions

    The following map displays New Brunswick’s five economic regions. An economic region (ER) is a grouping of counties, created as a standard unit for analysis of regional economic activity across Canada.

    Annual Average Salary by Economic Regions

    The following graph shows the average salary of all persons employed in this occupation in each of New Brunswick’s five economic regions.

    Data legend

    $70,000
    Northeast
    $64,000
    Southeast
    $96,000
    Southwest
    $72,000
    Central
    N/A
    Northwest
    Province of New Brunswick Economic Regions

    Economic Regions

    The following map displays New Brunswick’s five economic regions. An economic region (ER) is a grouping of counties, created as a standard unit for analysis of regional economic activity across Canada.

    Hourly Median Wages by Economic Regions

    The following represents the median hourly wage of all persons employed in this occupation in each of New Brunswick’s five economic regions.

    Northeast

    $42.00
    $26.00
    Low
    $46.45
    High

    Southeast

    $37.50
    $20.00
    Low
    $47.00
    High

    Southwest

    $42.00
    $27.30
    Low
    $44.57
    High
    No Data Available
    No Data Available
    Salary

    The following shows the average salary of everyone who worked full-time and year-round in this occupation across each of the Atlantic Provinces and nationally.

    New Brunswick

    $79,000

    Newfoundland

    $94,000

    Prince Edward Island

    N/A

    Nova Scotia

    $73,500

    Canada

    $84,600
    Employment Outlook

    The following represents the number of job openings that are expected to occur in this occupation over the next three and ten years respectively, broken down by openings expected to result from growth (“new jobs”) and openings expected to result from attrition (death and retirements).

    Three Year Outlook

    Total Openings: 3-Year

    59
     

    New Jobs: 3-Year

    21
     

    Retirements/Deaths: 3-Year

    38
     

    Ten Year Outlook

    Total Openings: 10-Year

    139
     

    New Jobs: 10-Year

    24
     

    Retirements/Deaths: 10-Year

    117