Managers in transportation

Managers in transportation

NOC
70020

manage and evaluate the operations of transportation companies such as railways, airlines, bus lines, shipping lines, and trucking companies.

Quick facts

3-Year Outlook

Moderate
Moderate

3-Year Job Openings

86
 

Median Hourly Wage

$39.90
$24.04
Low
$84.13
High

Average Salary

$91,600
 

Typically Required

College or apprenticeship

Employed

759
 
Job details

Full NOC Description

Managers in transportation operations plan, organize, direct, control and evaluate the operations of transportation companies such as railways, airlines, bus lines, municipal transit systems, shipping lines and trucking companies, under the direction of a general manager or another senior manager. Managers in transportation freight traffic plan, organize, direct, control and evaluate companies or departments responsible for the transportation and movement of goods, under the direction of a general manager or another senior manager.

Main Duties

This group performs some or all of the following duties:
  • Managers in transportation operations
  • Plan, organize, direct, control and evaluate the operations of a transportation company
  • Set operations policies and standards, including determination of safety procedures for the handling of dangerous goods, and ensure compliance with transport regulations
  • Oversee the dispatch, maintenance and service of vehicles, vessels or aircraft
  • Control the company or departmental budget, including acquisitions
  • Monitor company's or department's performance, prepare reports for senior management, and plan for changes to schedules and policies
  • Recruit personnel and oversee their training.
  • Managers in transportation freight traffic
  • Plan, organize, direct, control and evaluate the operation of or department responsible for coordinating, arranging and monitoring the transportation and movement of goods
  • Arrange shipping documentation and oversee the schedule, dispatch and tracking of goods
  • Set transportation service rates and performance indicators
  • Develop plans and procedures for the transportation and storage of goods
  • Negotiate with carriers, warehouse operators and insurance company representatives for services and preferential rates
  • Control the departmental budget
  • Recruit personnel and oversee their training.
  • Also Known As

    • bus company manager
    • distribution manager - logistics
    • flight operations manager
    • freight forwarding manager
    • marine superintendent
    • rail operations superintendent
    • railway freight manager
    • traffic manager - transportation
    • transport department manager
    • transportation manager
    • urban transit system manager
    Requirements

    Employment Requirements

    Managers in transportation operations
  • A bachelor's degree in business administration or engineering is usually required.
  • Several years of experience in transportation operations are usually required, including supervisory experience.
  • Extensive experience as a supervisor and operator in a particular transport mode, such as a pilot, train engineer, vessel master or truck driver, may substitute for formal education.
  • Certification as an operator of a particular mode of transportation, such as commercial pilot, vessel master or truck driver, is usually required.
  • Managers in transportation freight traffic
  • Completion of secondary school is required.
  • A college diploma or university degree in business or transportation administration may be required.
  • Several years of clerical, operational or administrative experience related to freight traffic are required.
  • Provincial Regulation

    Not Provincially Regulated

    Employment by Sex

    The following graph shows the percentage of men and women working in this occupation in New Brunswick.

    Data legend

    24.8%
    Female
    75.2%
    Male
    Employment by age

    The following graph shows the breakdown of all persons working in this occupation in New Brunswick by age group.

    Data legend

    2.1%
    15-24
    9.7%
    25-34
    24.1%
    35-44
    39.3%
    45-54
    20.7%
    55-64
    4.1%
    65+
    Employment by highest level of education

    The following graph shows the breakdown of all persons working in this occupation in New Brunswick by highest level of education achieved.

    Data legend

    4.9%
    No Certificate, Diploma or Degree
    30.6%
    High School, Diploma or Equivalent
    9.0%
    Apprenticeship or Trades Certificate or Diploma
    34.0%
    College or University Below Bachelor Level
    21.5%
    University - Bachelor Level or Above
    Employment by Industry

    The following graph shows the industry groups in which the largest shares of persons working in this occupation in New Brunswick are employed. Small percentages for all top three industry groups may suggest employment for this occupation is widely distributed amongst many industry groups.

    Data legend

    57.9%
    Transportation and warehousing
    8.3%
    Wholesale trade
    7.6%
    Manufacturing
    26.2%
    All Other Industries
    Employment by Economic Regions

    The following graph shows the breakdown of all persons employed in this occupation in New Brunswick by which economic region they reside in.

    Data legend
    6.30%
    Northeast
    41.30%
    Southeast
    20.30%
    Southwest
    15.40%
    Central
    16.80%
    Northwest
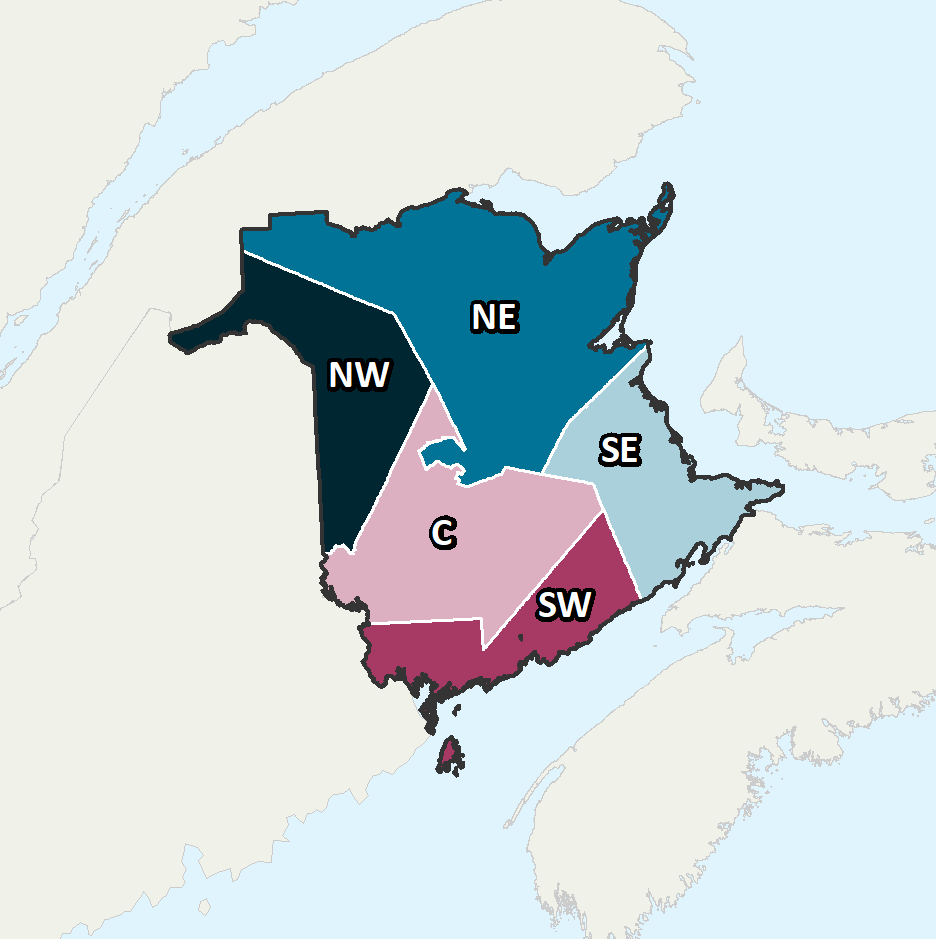
    Province of New Brunswick Economic Regions

    Economic Regions

    The following map displays New Brunswick’s five economic regions. An economic region (ER) is a grouping of counties, created as a standard unit for analysis of regional economic activity across Canada.

    Annual Average Salary by Economic Regions

    The following graph shows the average salary of all persons employed in this occupation in each of New Brunswick’s five economic regions.

    Data legend

    $80,000
    Northeast
    $89,000
    Southeast
    $108,000
    Southwest
    $94,000
    Central
    $78,000
    Northwest
    Province of New Brunswick Economic Regions

    Economic Regions

    The following map displays New Brunswick’s five economic regions. An economic region (ER) is a grouping of counties, created as a standard unit for analysis of regional economic activity across Canada.

    Hourly Median Wages by Economic Regions

    The following represents the median hourly wage of all persons employed in this occupation in each of New Brunswick’s five economic regions.

    Northeast

    $42.77
    $25.98
    Low
    $66.18
    High
    No Data Available

    Southwest

    $40.78
    $25.76
    Low
    $64.91
    High

    Central

    $41.99
    $26.89
    Low
    $65.20
    High

    Northwest

    $41.16
    $24.57
    Low
    $62.12
    High
    Salary

    The following shows the average salary of everyone who worked full-time and year-round in this occupation across each of the Atlantic Provinces and nationally.

    New Brunswick

    $91,600

    Newfoundland

    $102,000

    Prince Edward Island

    $80,000

    Nova Scotia

    $84,800

    Canada

    $98,700
    Employment Outlook

    The following represents the number of job openings that are expected to occur in this occupation over the next three and ten years respectively, broken down by openings expected to result from growth (“new jobs”) and openings expected to result from attrition (death and retirements).

    Three Year Outlook

    Total Openings: 3-Year

    86
     

    New Jobs: 3-Year

    28
     

    Retirements/Deaths: 3-Year

    57
     

    Ten Year Outlook

    Total Openings: 10-Year

    271
     

    New Jobs: 10-Year

    35
     

    Retirements/Deaths: 10-Year

    238