Service station attendants

Service station attendants

NOC
65101

in automotive service stations, sell fuel and perform such services as fuelling, cleaning and lubricating; in marinas, sell fuel, rent boats and maintain marina facilities.

Quick facts

3-Year Outlook

Undetermined
Undetermined

3-Year Job Openings

28
 

Median Hourly Wage

$15.30
$15.30
Low
$16.00
High

Average Salary

$29,200
 

Typically Required

High school / on-the-job training

Employed

319
 
Job details

Full NOC Description

Service station attendants employed in automotive service stations sell fuel and other automotive products and perform such services as fuelling, cleaning, lubricating and performing minor repairs to motor vehicles. Those employed in marinas sell fuel, rent boats and related equipment, and maintain marina facilities.

Main Duties

This group performs some or all of the following duties:
  • Automotive service station attendants
  • Refuel vehicles
  • Perform minor service and maintenance such as washing the windshield, checking fluid levels and air pressure, and replacing parts such as tires, light bulbs and windshield-wiper blades
  • Receive payment from customers
  • Perform minor property maintenance duties such as sweeping service station lot, trimming shrubs, scrubbing service bays and painting curbs
  • May pick up and deliver customers' cars for service station automotive repair department.
  • Marina service station attendants
  • Refuel boats
  • Pump boat's marine septic system
  • Rent boats, life jackets and other equipment and record rental data
  • Receive payment from customers
  • Maintain dock area and marina facilities and assist in seasonal moving of ramps and docks.
  • Also Known As

    • gas station attendant (except self-serve)
    • marina attendant
    • service station attendant
    Requirements

    Employment Requirements

    Some secondary school education is usually required.
  • Propane and natural gas pump attendants may require an operator's licence.
  • Provincial Regulation

    Not Provincially Regulated

    Employment by Sex

    The following graph shows the percentage of men and women working in this occupation in New Brunswick.

    Data legend

    19.0%
    Female
    81.0%
    Male
    Employment by age

    The following graph shows the breakdown of all persons working in this occupation in New Brunswick by age group.

    Data legend

    51.7%
    15-24
    13.8%
    25-34
    13.8%
    35-44
    8.6%
    45-54
    8.6%
    55-64
    3.4%
    65+
    Employment by highest level of education

    The following graph shows the breakdown of all persons working in this occupation in New Brunswick by highest level of education achieved.

    Data legend

    30.8%
    No Certificate, Diploma or Degree
    51.3%
    High School, Diploma or Equivalent
    0.0%
    Apprenticeship or Trades Certificate or Diploma
    17.9%
    College or University Below Bachelor Level
    0.0%
    University - Bachelor Level or Above
    Employment by Industry

    The following graph shows the industry groups in which the largest shares of persons working in this occupation in New Brunswick are employed. Small percentages for all top three industry groups may suggest employment for this occupation is widely distributed amongst many industry groups.

    Data legend

    96.6%
    Retail trade
    N/A
    N/A
    N/A
    N/A
    3.4%
    All Other Industries
    Employment by Economic Regions

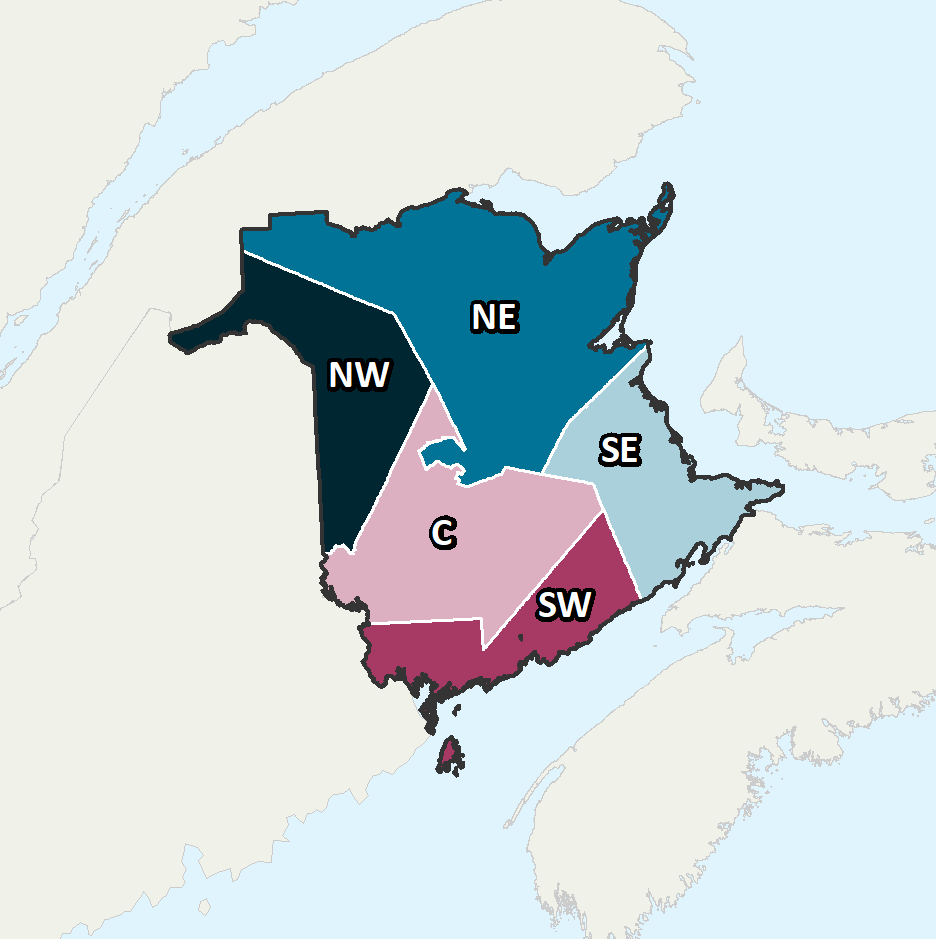
    The following graph shows the breakdown of all persons employed in this occupation in New Brunswick by which economic region they reside in.

    Data legend
    32.80%
    Northeast
    19.00%
    Southeast
    8.60%
    Southwest
    22.40%
    Central
    17.20%
    Northwest
    Province of New Brunswick Economic Regions

    Economic Regions

    The following map displays New Brunswick’s five economic regions. An economic region (ER) is a grouping of counties, created as a standard unit for analysis of regional economic activity across Canada.

    Annual Average Salary by Economic Regions

    The following graph shows the average salary of all persons employed in this occupation in each of New Brunswick’s five economic regions.

    No Data Available

    Data legend

    No Data Available
    Province of New Brunswick Economic Regions

    Economic Regions

    The following map displays New Brunswick’s five economic regions. An economic region (ER) is a grouping of counties, created as a standard unit for analysis of regional economic activity across Canada.

    Hourly Median Wages by Economic Regions

    The following represents the median hourly wage of all persons employed in this occupation in each of New Brunswick’s five economic regions.

    No Data Available
    Salary

    The following shows the average salary of everyone who worked full-time and year-round in this occupation across each of the Atlantic Provinces and nationally.

    New Brunswick

    $29,200

    Newfoundland

    $35,000

    Prince Edward Island

    $28,000

    Nova Scotia

    $34,000

    Canada

    $34,120
    Employment Outlook

    The following represents the number of job openings that are expected to occur in this occupation over the next three and ten years respectively, broken down by openings expected to result from growth (“new jobs”) and openings expected to result from attrition (death and retirements).

    Three Year Outlook

    Total Openings: 3-Year

    28
     

    New Jobs: 3-Year

    21
     

    Retirements/Deaths: 3-Year

    6
     

    Ten Year Outlook

    Total Openings: 10-Year

    66
     

    New Jobs: 10-Year

    44
     

    Retirements/Deaths: 10-Year

    22