Musicians and singers

Musicians and singers

NOC
51122

perform with orchestras, choirs and bands in various venues and in film, television and recording studios, or teach in conservatories, academies and private homes.

Quick facts

3-Year Outlook

Undetermined
Undetermined

3-Year Job Openings

40
 

Median Hourly Wage

N/A

Average Salary

$32,000
 

Typically Required

University

Employed

364
 
Job details

Full NOC Description

Musicians and singers perform with orchestras, choirs, opera companies and popular bands in establishments such as concert halls, lounges and theatres and in film, television and recording studios. This unit group also includes music teachers who usually teach in conservatories, academies and private homes.

Main Duties

This group performs some or all of the following duties:
  • Musicians
  • Play one or more instruments as soloists or as members of a musical group before audiences or for recording purposes.
  • Singers
  • Sing musical arrangements as soloists or as members of vocal groups before audiences or for recording purposes.
  • Teachers of music or voice
  • Teach technique, interpretation and music theory to students through private or group lessons.
  • Musicians and singers usually specialize in specific genres of music such as classical, country, ethnic, jazz, opera or popular music.
  • Also Known As

    • accompanist
    • church organist
    • guitar player
    • instrumentalist
    • music teacher - musicians
    • musician
    • opera singer
    • percussionist
    • recording artist
    • rock singer
    • singer
    • vocalist
    Requirements

    Employment Requirements

    Musical training from a university or college or through private instruction is usually required.
  • Members of orchestras and other professional classical musicians and singers usually require a university degree in music.
  • Musical talent and ability, as demonstrated during an audition, are important hiring criteria.
  • Membership in a guild or union related to the occupation or type of performance may be required.
  • Provincial Regulation

    Not Provincially Regulated

    Employment by Sex

    The following graph shows the percentage of men and women working in this occupation in New Brunswick.

    Data legend

    55.4%
    Female
    44.6%
    Male
    Employment by age

    The following graph shows the breakdown of all persons working in this occupation in New Brunswick by age group.

    Data legend

    2.7%
    15-24
    28.4%
    25-34
    14.9%
    35-44
    20.3%
    45-54
    16.2%
    55-64
    17.6%
    65+
    Employment by highest level of education

    The following graph shows the breakdown of all persons working in this occupation in New Brunswick by highest level of education achieved.

    Data legend

    2.7%
    No Certificate, Diploma or Degree
    17.6%
    High School, Diploma or Equivalent
    0.0%
    Apprenticeship or Trades Certificate or Diploma
    13.5%
    College or University Below Bachelor Level
    66.2%
    University - Bachelor Level or Above
    Employment by Industry

    The following graph shows the industry groups in which the largest shares of persons working in this occupation in New Brunswick are employed. Small percentages for all top three industry groups may suggest employment for this occupation is widely distributed amongst many industry groups.

    Data legend

    55.4%
    Educational services
    17.6%
    Arts, entertainment and recreation
    9.5%
    Other services (except public administration)
    17.6%
    All Other Industries
    Employment by Economic Regions

    The following graph shows the breakdown of all persons employed in this occupation in New Brunswick by which economic region they reside in.

    Data legend
    8.00%
    Northeast
    37.30%
    Southeast
    28.00%
    Southwest
    17.30%
    Central
    9.30%
    Northwest
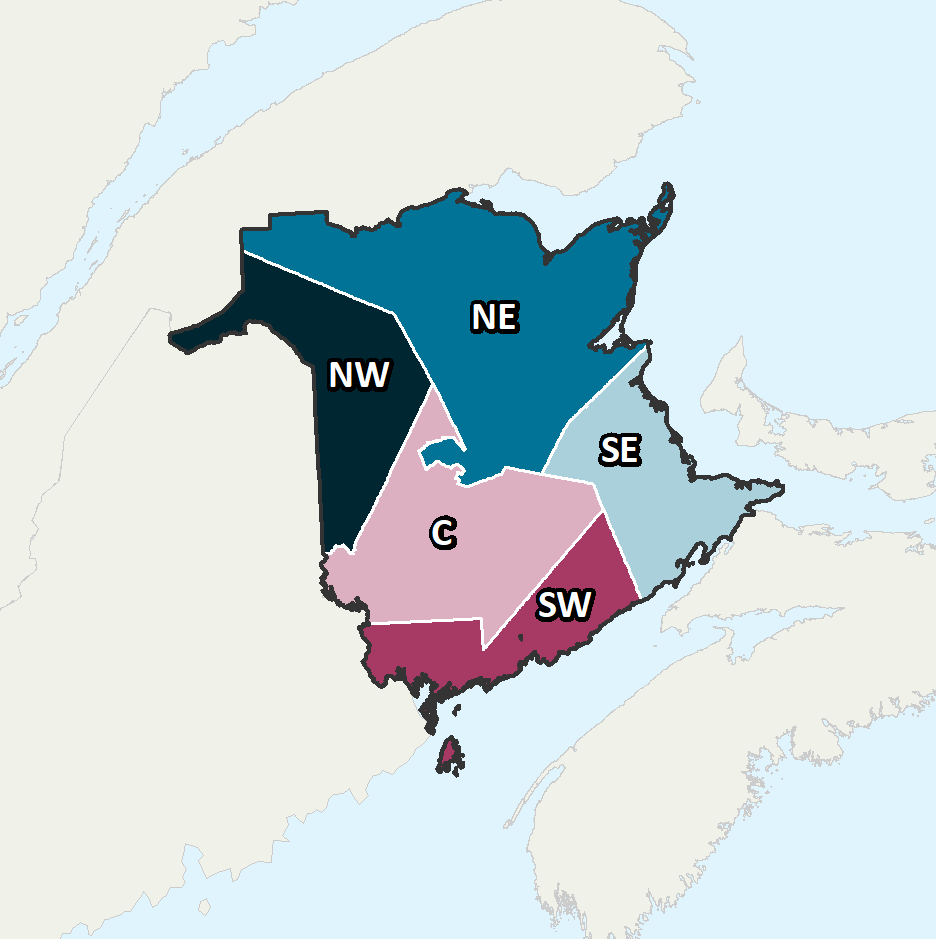
    Province of New Brunswick Economic Regions

    Economic Regions

    The following map displays New Brunswick’s five economic regions. An economic region (ER) is a grouping of counties, created as a standard unit for analysis of regional economic activity across Canada.

    Annual Average Salary by Economic Regions

    The following graph shows the average salary of all persons employed in this occupation in each of New Brunswick’s five economic regions.

    Data legend

    N/A
    Northeast
    $34,000
    Southeast
    N/A
    Southwest
    N/A
    Central
    N/A
    Northwest
    Province of New Brunswick Economic Regions

    Economic Regions

    The following map displays New Brunswick’s five economic regions. An economic region (ER) is a grouping of counties, created as a standard unit for analysis of regional economic activity across Canada.

    Hourly Median Wages by Economic Regions

    The following represents the median hourly wage of all persons employed in this occupation in each of New Brunswick’s five economic regions.

    No Data Available
    Salary

    The following shows the average salary of everyone who worked full-time and year-round in this occupation across each of the Atlantic Provinces and nationally.

    New Brunswick

    $32,000

    Newfoundland

    $23,000

    Prince Edward Island

    $32,000

    Nova Scotia

    $36,500

    Canada

    $32,800
    Employment Outlook

    The following represents the number of job openings that are expected to occur in this occupation over the next three and ten years respectively, broken down by openings expected to result from growth (“new jobs”) and openings expected to result from attrition (death and retirements).

    Three Year Outlook

    Total Openings: 3-Year

    40
     

    New Jobs: 3-Year

    3
     

    Retirements/Deaths: 3-Year

    37
     

    Ten Year Outlook

    Total Openings: 10-Year

    122
     

    New Jobs: 10-Year

    25
     

    Retirements/Deaths: 10-Year

    99