Financial advisors

Financial advisors

NOC
11102

counsel individuals on financial decisions such as investments, cash management, and estate planning. They establish personal financial plans according to clients' objectives.

Quick facts

3-Year Outlook

Good
Good

3-Year Job Openings

173
 

Median Hourly Wage

$29.74
$20.00
Low
$60.59
High

Average Salary

$112,000
 

Typically Required

University

Employed

1,745
 
Job details

Full NOC Description

Financial advisors counsel individuals on financial decisions such as investments, cash management, and estate planning. They establish personal financial plans according to clients' objectives and guide them through the implementation of the proposed strategies that may be adjusted as the situation evolve. They are employed by banks, trust companies and investment firms, or they may be self-employed.

Main Duties

This group performs some or all of the following duties:
  • Develop personal financial plans for clients covering cash management, finances, insurance coverage, investments, retirement and estate planning, taxes and legal matters
  • Analyze clients' financial records, set goals and develop a financial strategy
  • Advise clients on implementing the financial plan to help them achieve their goals
  • May also arrange for the purchase and sale of financial products and investments depending on the licence held, and monitor the portfolio to ensure its quality and profitability
  • May help to expand business and attract new clients.
  • Also Known As

    • account manager
    • financial advisor
    • financial consultant
    • financial planner
    • financial security advisor
    • personal finance advisor
    • personal investment advisor
    Requirements

    Employment Requirements

    A bachelor's degree in business administration, commerce, economics or a related field is usually required.
  • The designation Certified Financial Planner, awarded by the Financial Planners Standards Council of Canada, may be required.
  • To sell regulated financial products and investments, such as annuities, RRSPs and life insurance, a licence is required from the appropriate governing body.
  • Certification as a Financial Planner is required in Quebec.
  • Various training programs and courses are offered by financial institutes and organizations, such as the Canadian Securities Institute, Institute of Canadian Bankers, CFA Institute, Investment Funds Institute, Canadian Institute of Financial Planning, and Trust Companies Institute of Canada, and may be required by employers.
  • Provincial Regulation

    Not Provincially Regulated

    Employment by Sex

    The following graph shows the percentage of men and women working in this occupation in New Brunswick.

    Data legend

    41.8%
    Female
    58.2%
    Male
    Employment by age

    The following graph shows the breakdown of all persons working in this occupation in New Brunswick by age group.

    Data legend

    3.4%
    15-24
    23.5%
    25-34
    31.0%
    35-44
    23.8%
    45-54
    12.9%
    55-64
    5.4%
    65+
    Employment by highest level of education

    The following graph shows the breakdown of all persons working in this occupation in New Brunswick by highest level of education achieved.

    Data legend

    0.3%
    No Certificate, Diploma or Degree
    17.0%
    High School, Diploma or Equivalent
    3.1%
    Apprenticeship or Trades Certificate or Diploma
    27.2%
    College or University Below Bachelor Level
    52.4%
    University - Bachelor Level or Above
    Employment by Industry

    The following graph shows the industry groups in which the largest shares of persons working in this occupation in New Brunswick are employed. Small percentages for all top three industry groups may suggest employment for this occupation is widely distributed amongst many industry groups.

    Data legend

    86.1%
    Finance and insurance
    3.7%
    Professional, scientific and technical services
    3.1%
    Public administration
    7.1%
    All Other Industries
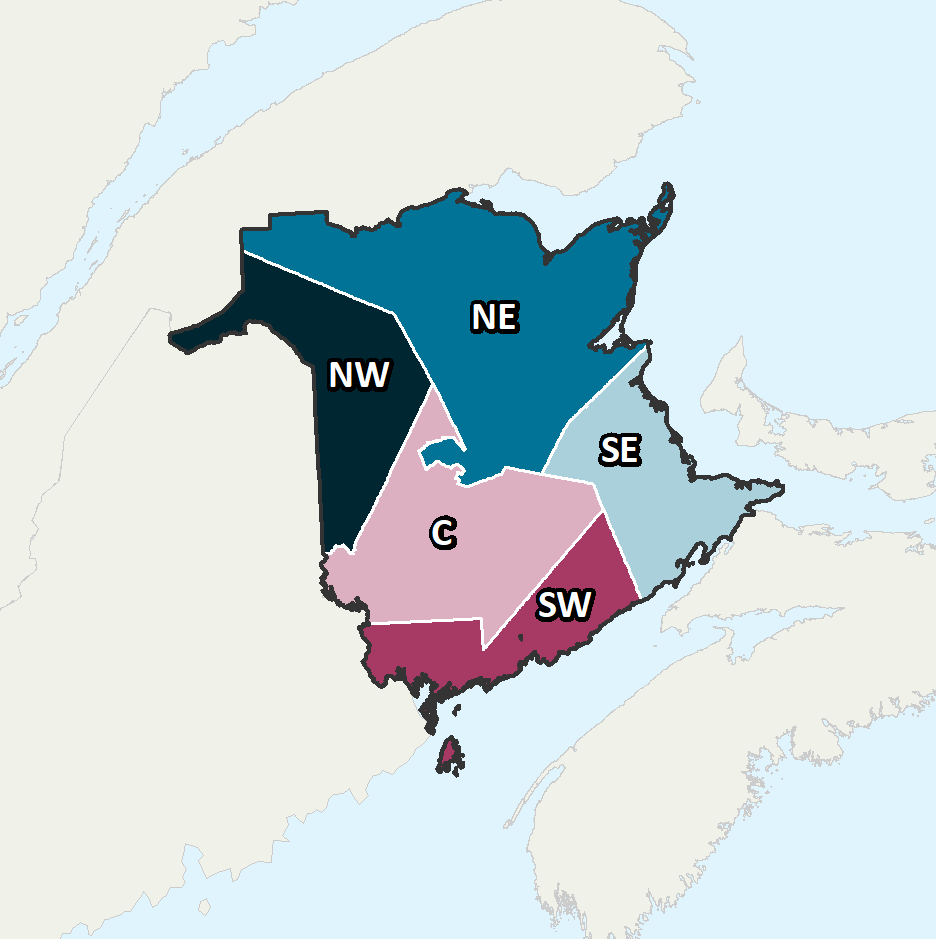
    Employment by Economic Regions

    The following graph shows the breakdown of all persons employed in this occupation in New Brunswick by which economic region they reside in.

    Data legend
    9.90%
    Northeast
    45.20%
    Southeast
    19.40%
    Southwest
    19.00%
    Central
    6.50%
    Northwest
    Province of New Brunswick Economic Regions

    Economic Regions

    The following map displays New Brunswick’s five economic regions. An economic region (ER) is a grouping of counties, created as a standard unit for analysis of regional economic activity across Canada.

    Annual Average Salary by Economic Regions

    The following graph shows the average salary of all persons employed in this occupation in each of New Brunswick’s five economic regions.

    Data legend

    $84,000
    Northeast
    $91,600
    Southeast
    $153,000
    Southwest
    $127,000
    Central
    $104,000
    Northwest
    Province of New Brunswick Economic Regions

    Economic Regions

    The following map displays New Brunswick’s five economic regions. An economic region (ER) is a grouping of counties, created as a standard unit for analysis of regional economic activity across Canada.

    Hourly Median Wages by Economic Regions

    The following represents the median hourly wage of all persons employed in this occupation in each of New Brunswick’s five economic regions.

    Northeast

    $26.68
    $21.00
    Low
    $51.79
    High

    Southeast

    $29.74
    $18.46
    Low
    $60.59
    High

    Southwest

    $29.74
    $20.00
    Low
    $60.59
    High

    Central

    $31.14
    $22.37
    Low
    $50.00
    High

    Northwest

    $29.74
    $20.00
    Low
    $60.59
    High
    Salary

    The following shows the average salary of everyone who worked full-time and year-round in this occupation across each of the Atlantic Provinces and nationally.

    New Brunswick

    $112,000

    Newfoundland

    $112,000

    Prince Edward Island

    $112,000

    Nova Scotia

    $121,100

    Canada

    $120,200
    Employment Outlook

    The following represents the number of job openings that are expected to occur in this occupation over the next three and ten years respectively, broken down by openings expected to result from growth (“new jobs”) and openings expected to result from attrition (death and retirements).

    Three Year Outlook

    Total Openings: 3-Year

    173
     

    New Jobs: 3-Year

    53
     

    Retirements/Deaths: 3-Year

    122
     

    Ten Year Outlook

    Total Openings: 10-Year

    629
     

    New Jobs: 10-Year

    221
     

    Retirements/Deaths: 10-Year

    410